forecast osc-30M
Download script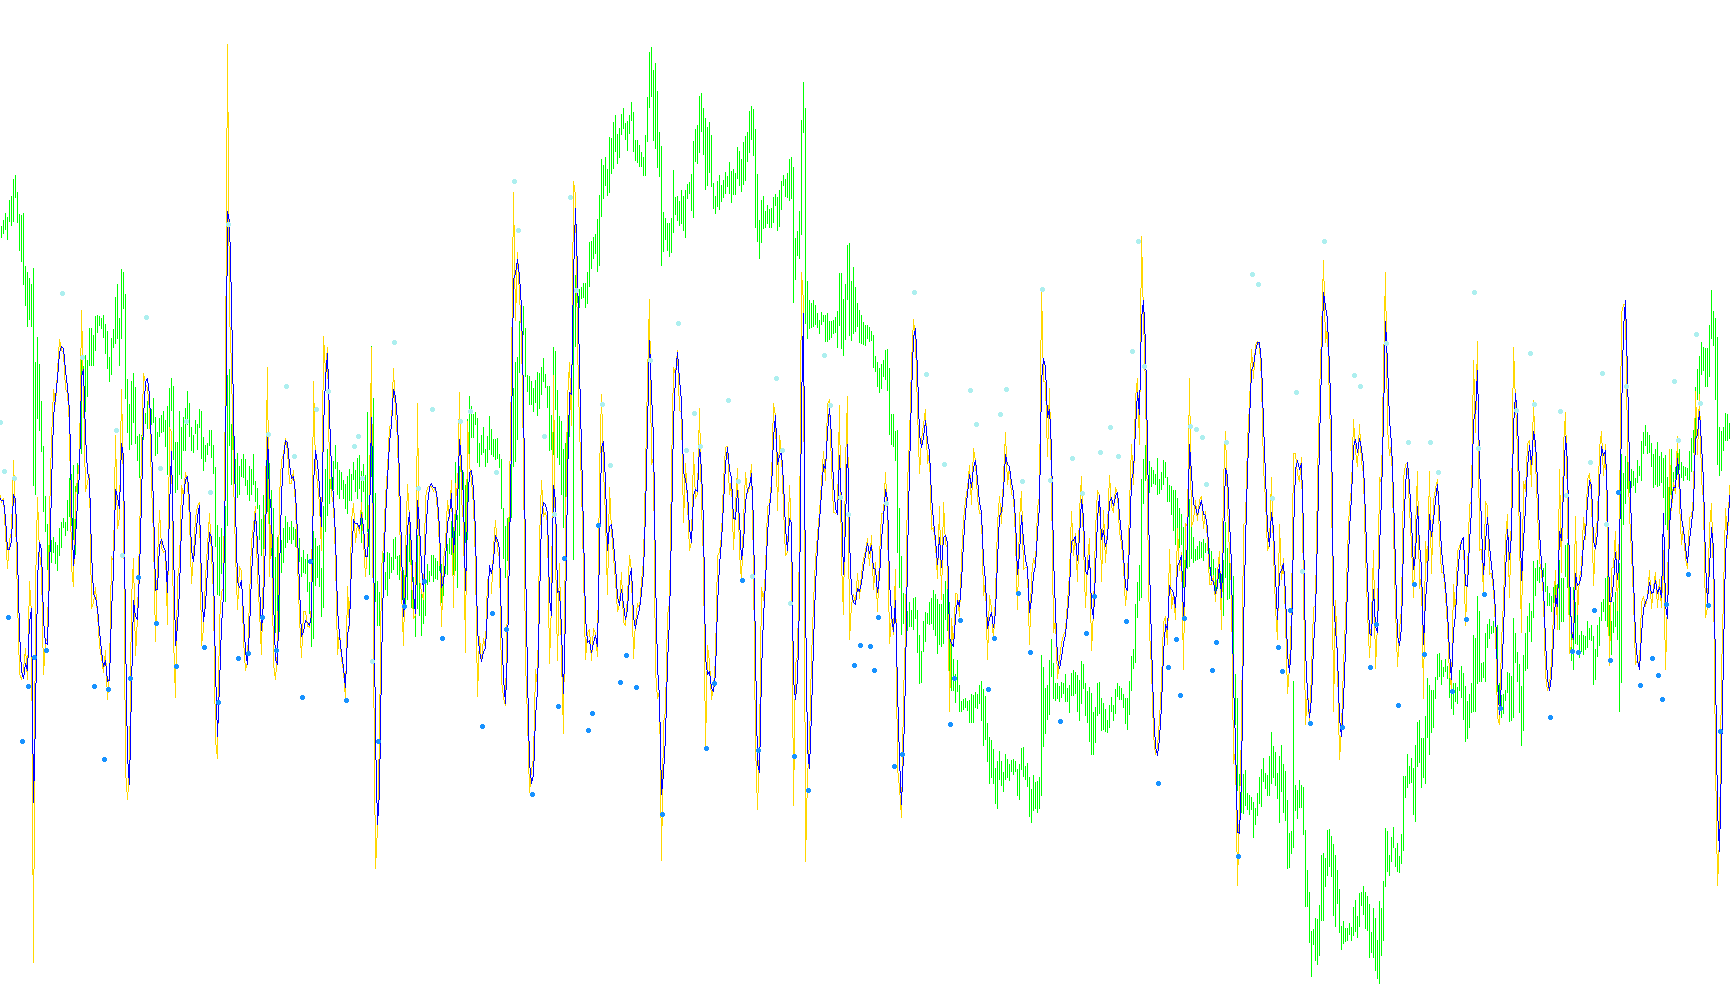
The Forecast Oscillator is a technical analysis tool designed to help traders identify potential price momentum and trend reversals by projecting future movements based on historical data. Instead of simply showing where the price has been, this script attempts to calculate a "forecast" value to provide a clearer picture of market direction.
How the Logic Works
1. Data Smoothing and Weighting The indicator begins by looking at a specific window of past prices (defined by the regression setting). It uses a weighted calculation method to ensure that more recent price movements have a significant impact on the current reading, while still maintaining the context of older data. This helps filter out "market noise"—the minor, erratic fluctuations that can often mislead traders.
2. The Forecasting Mechanism The core of the script involves two primary mathematical processes:
- Weighted Trend Analysis: It calculates a weighted average to determine the current underlying trend of the asset.
- Oscillation Calculation: By comparing the current price against this weighted average, the script generates a "Forecast Oscillator." This value tells you how far the price has deviated from its expected path.
3. Multi-Layered Smoothing (T3) To make the forecast more reliable and less jittery, the script applies a specialized smoothing technique known as a T3 filter. It processes the forecast through several layers of calculation to refine the curve. This ensures that the signals provided are stable and represent a meaningful trend rather than a temporary spike in price.
Visual Signals for Traders
The indicator provides three distinct visual elements to assist with decision-making:
- Primary Forecast Line: A continuous line that represents the smoothed oscillator value, showing the current momentum of the market.
- Secondary Trend Line: A secondary processed line (T3) that helps identify the "true" direction of the forecast after high-level smoothing.
- Buy and Sell Markers: The script automatically identifies specific points where the forecast lines cross or react in a certain way. When these conditions are met—specifically when the oscillator crosses over the smoothed trend line while below or above the zero mark—the indicator places small arrows on the chart:
- High Signals (Buy): Appear when the price momentum shows a potential upward turn from an oversold position.
- Low Signals (Sell): Appear when the price momentum shows a potential downward turn from an overbought position.
Summary of Use
By combining regression analysis with advanced smoothing, this tool is designed to help traders see "ahead" of the immediate price action. It identifies periods where the market is stretched too far in one direction and highlights potential entry points where the trend is likely to shift.
//+------------------------------------------------------------------+
//|                                                 forecast osc.mq4 |
//|                Copyright © 2005, Nick Bilak, beluck[AT]gmail.com |
//|                                    http://metatrader.50webs.com/ |
//+------------------------------------------------------------------+
#property copyright "Copyright © 2005, Nick Bilak"
#property link      "http://metatrader.50webs.com/"

#property indicator_separate_window
#property indicator_buffers 4
#property indicator_level1 0
#property indicator_color1 SteelBlue
#property indicator_color2 Red
#property indicator_color3 White
#property indicator_color4 White
//---- input parameters
extern int       regress=15;
extern int       t3=3;
extern double    b=0.7;
//---- buffers
double osc[];
double osct3[];
double hiSig[];
double loSig[];

int shift,limit,length;
double b2,b3,c1,c2,c3,c4,w1,w2,n,WT,forecastosc,t3_fosc,sum,e1,e2,e3,e4,e5,e6,tmp,tmp2;

//+------------------------------------------------------------------+
//| Custom indicator initialization function                         |
//+------------------------------------------------------------------+
int init()
  {
//---- indicators
//   SetIndexStyle(0,DRAW_HISTOGRAM);
   SetIndexStyle(0,DRAW_LINE);
   SetIndexBuffer(0,osc);
   SetIndexEmptyValue(0,0);
   SetIndexStyle(1,DRAW_LINE);
   SetIndexBuffer(1,osct3);

   SetIndexStyle(2,DRAW_ARROW);
   SetIndexBuffer(2,hiSig);
   SetIndexEmptyValue(2,EMPTY_VALUE);
   SetIndexArrow(2,159);
   SetIndexStyle(3,DRAW_ARROW);
   SetIndexBuffer(3,loSig);
   SetIndexEmptyValue(3,EMPTY_VALUE);
   SetIndexArrow(3,159);
//----
   return(0);
  }
//+------------------------------------------------------------------+
//| Custor indicator deinitialization function                       |
//+------------------------------------------------------------------+
int deinit()
  {
   return(0);
  }
//+------------------------------------------------------------------+
//| Custom indicator iteration function                              |
//+------------------------------------------------------------------+
int start()
  {
   int counted_bars=IndicatorCounted();

   if (counted_bars<0) return(-1);
   if (counted_bars>0) counted_bars--;
   limit=Bars-31;
   if(counted_bars>=31) limit=Bars-counted_bars+2;

   for (shift=limit+30;shift>=0;shift--)   {

      b2=b*b;
      b3=b2*b;
      c1=-b3;
      c2=(3*(b2+b3));
      c3=-3*(2*b2+b+b3);
      c4=(1+3*b+b3+3*b2);
      n=t3;

      if (n<1) n=1;
      n = 1 + 0.5*(n-1);
      w1 = 2 / (n + 1);
      w2 = 1 - w1;

      length=regress;
      sum = 0;
      for (int i = length; i>0; i--) {
         tmp = length+1;
         tmp = tmp/3;
         tmp2 = i;
         tmp = tmp2 - tmp;
         sum = sum + tmp*Close[shift+length-i];
      }
      tmp = length;
      WT = sum*6/(tmp*(tmp+1));

      forecastosc=(Close[shift]-WT)/WT*100;

      e1 = w1*forecastosc + w2*e1;
      e2 = w1*e1 + w2*e2;
      e3 = w1*e2 + w2*e3;
      e4 = w1*e3 + w2*e4;
      e5 = w1*e4 + w2*e5;
      e6 = w1*e5 + w2*e6;

      t3_fosc = c1*e6 + c2*e5 + c3*e4 + c4*e3;

      osc[shift] = forecastosc;
      osct3[shift] = t3_fosc;

      if (osc[shift+1] > osct3[shift+2] && osc[shift+2] <= osct3[shift+3] && osct3[shift+1]<0) loSig[shift+1] = t3_fosc-0.05;
      if (osc[shift+1] < osct3[shift+2] && osc[shift+2] >= osct3[shift+3] && osct3[shift+1]>0) hiSig[shift+1] = t3_fosc+0.05;

   }
   return(0);
  }
//+------------------------------------------------------------------+
Comments