File Read Write
Indicator

File Read Write

This script utilizes low-level Windows kernel32 DLL calls to perform raw byte-stream reading, seeking, and writing operations between external text files.
Indicator

FilesDemo

Filter overRSI
Indicator

Filter overRSI

iRSI

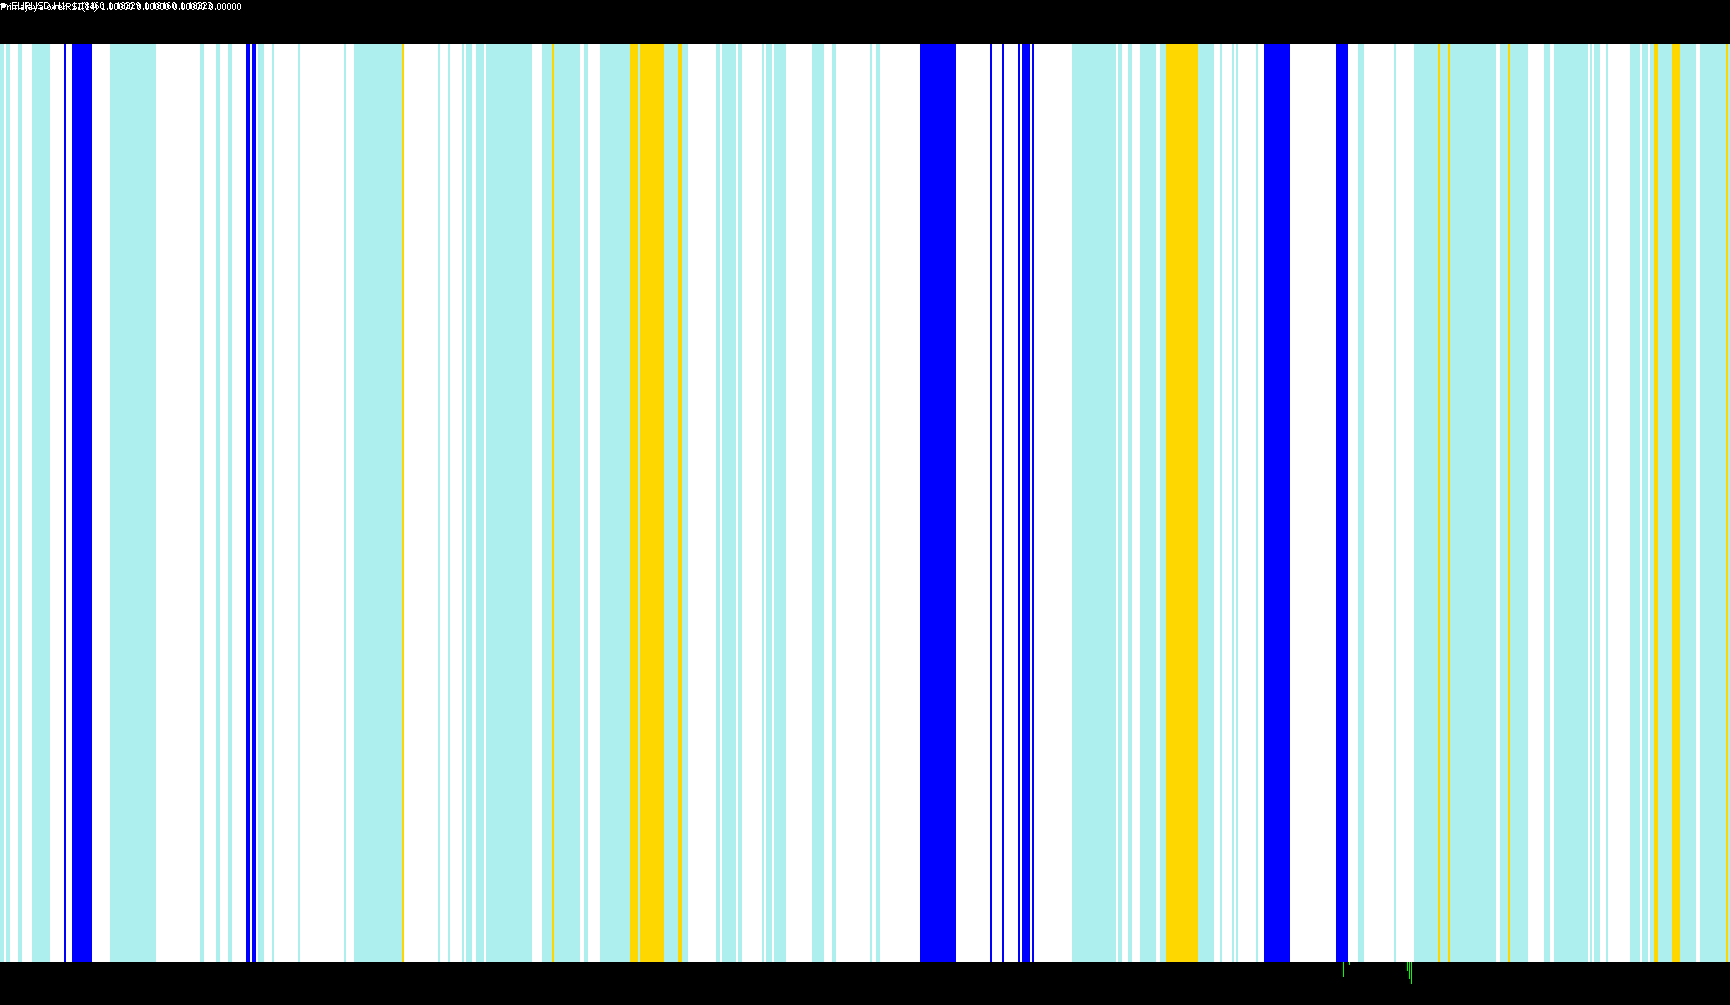
This indicator categorizes market dynamics into four distinct zones by mapping Relative Strength Index values to specific bullish and bearish momentum thresholds.

Filter overStochastic
Indicator

Filter overStochastic

iStochastic

This indicator categorizes market sentiment into four distinct zones—Strong Bulls, Strong Bears, Potential Bullish, and Potential Bearish—by analyzing stochastic price action relative to predefined threshold boundaries.

FILTER_ADX_(AM)
Indicator

FILTER_ADX_(AM)

This indicator identifies bullish and bearish trend shifts by detecting specific convergences between the Average Directional Index (ADX) slope and the relative positions of the Positive and Negative Directional Indicators (+DI/-DI).

Filter_AO Alert
Indicator

Filter_AO Alert

iMA

This indicator visualizes trend direction by calculating the differential between two exponential moving averages and filtering momentum shifts through color-coded histogram changes.

Filter_AO
Indicator

Filter_AO

iMA

This indicator isolates specific directional momentum by visualizing the trend of an exponential moving average spread using a dual-histogram histogram technique.

Filter_AO_001
Indicator

Filter_AO_001

iMA

This indicator identifies directional momentum shifts by isolating histogram segments based on the relative growth or decay of a dual Exponential Moving Average spread.

Filter_overWPR
Indicator

Filter_overWPR

iStochastic

This indicator classifies market conditions into four distinct behavioral states—extreme oversold, extreme overbought, and emerging bullish or bearish momentum—by analyzing Stochastic Oscillator main and signal line crossovers relative to predefined intensity thresholds.

Indicator

Final Draft 3 Semafor

Final Draft ArrZZx2_alerts
Indicator

Final Draft ArrZZx2_alerts

iMA

This indicator utilizes a multi-stage weighted price smoothing algorithm to identify structural pivot points and generate predictive trend reversal signals.

Find Data Holes
Indicator

Find Data Holes

Identifies significant chronological gaps in historical price data by detecting discrepancies between consecutive bar timestamps that exceed the expected period duration.

Find Data Holes_v1
Indicator

Find Data Holes_v1

Indicator

Fine_Fractals

iFractals
Fine_Fractals_v1
Indicator

Fine_Fractals_v1

iFractals
Indicator

Firebird HMA [i]

iMA
Indicator

Firebird [i]

Firebird-v63H-SafeArea-ind
Indicator

Firebird-v63H-SafeArea-ind

iBearsPoweriBullsPower

Calculates the absolute deviation of combined weighted power dynamics from a predefined volatility threshold to identify structural price exhaustion.

Firebird
Indicator

Firebird

This indicator projects upper and lower price boundaries by applying a user-defined percentage variance to a simple moving average of the opening prices.

Indicator

Firebird_HMA_[i]

iMA
Firebird_v2
Indicator

Firebird_v2

This indicator calculates a dual-band threshold by applying a specific percentage deviation to the Simple Moving Average of opening prices.

Indicator

Firestats v0.5

iMA
Indicator

Firestats2 v0.10

iMA
FirstStrike
Indicator

FirstStrike

This indicator identifies price turning points by recursively analyzing the chronological order of high and low price extremes across nested lower timeframes.

FIR_MA
Indicator

FIR_MA

This indicator implements a Finite Impulse Response (FIR) filter using configurable windowing functions to synthesize specific frequency responses from price data.

FIR_MA_001
Indicator

FIR_MA_001

This indicator applies a Finite Impulse Response (FIR) filter to price data by utilizing a sinc function coupled with selectable windowing techniques—such as Hamming, Hanning, or Blackman—to achieve precise spectral bandwidth control.

Fisher Transform for CCO, COGO or RVI
Indicator

Fisher Transform for CCO, COGO or RVI

iRSI

This indicator synthesizes multiple momentum signals into a normalized stochastic range, then applies a logarithmic Fisher Transform to highlight price exhaustion and trend reversal points.

Fisher Transform for CCO, COGO or RVI_001
Indicator

Fisher Transform for CCO, COGO or RVI_001

iRSI

This indicator applies a stochastic normalization to multiple underlying oscillators followed by a logarithmic transformation to visualize momentum intensity.

Fisher Transform over Stochastic Oscillator
Indicator

Fisher Transform over Stochastic Oscillator

iStochastic

The indicator transforms standard stochastic values into a logarithmic growth curve to highlight smoothed momentum velocity and trend exhaustion.

Fisher Transform
Indicator

Fisher Transform

iMA

This indicator transforms the Williams Percent Range into a logarithmic scale to visualize market momentum and trend reversals through Fisher-weighted smoothing.

Fisher Transform_v1
Indicator

Fisher Transform_v1

iMA

This indicator applies a logarithmic transformation to price action to identify extreme momentum shifts and potential trend exhaustion points.

FisherCG
Indicator

FisherCG

This indicator synthesizes cybernetic center of gravity calculations with a logarithmic sigmoid transformation to identify non-linear momentum shifts and price extremes.

FisherCyberCycle
Indicator

FisherCyberCycle

This indicator applies a cybernetic cycle analysis to smoothed price averages to extract underlying rhythmic components and normalize them into a logarithmic Fisher transformation.

FisherCyberCycle_v1
Indicator

FisherCyberCycle_v1

This algorithm utilizes a multi-stage cybernetic filter to normalize price fluctuations into a logarithmic cycle, identifying momentum shifts through smoothed second-order difference calculations.

FisherKus_Star11
Indicator

FisherKus_Star11

The indicator utilizes price location relative to the high-low range over a defined period, applying logarithmic transformation and dual-layered smoothing to isolate trend direction.

FisherRVI
Indicator

FisherRVI

This indicator synthesizes a weighted price range ratio with logarithmic smoothing to identify momentum shifts and trend exhaustion through relative vigor analysis.

FisherTransform
Indicator

FisherTransform

Normalizes price extremes into a bounded range using a logarithmic transformation to identify overextended momentum shifts.

Fisher_exit
Indicator

Fisher_exit

Identifies potential trend exhaustion points by detecting local peak and valley inversions within the Fisher Oscillator values.

Fisher_exit_v1
Indicator

Fisher_exit_v1

This indicator identifies potential trend exhaustion by detecting local peaks and troughs within the Fisher Transform momentum oscillations to signal strategic exit points.

Fisher_m11
Indicator

Fisher_m11

This indicator quantifies relative price position within a rolling range using logarithmic scaling to identify smoothed momentum trends.

Fisher_m11_001
Indicator

Fisher_m11_001

This indicator quantifies price position relative to the high-low range of a lookback period, applies recursive smoothing, and transforms the result through a logarithmic function to visualize trend intensity.

Fisher_m11_002
Indicator

Fisher_m11_002

This indicator identifies trend direction by applying logarithmic transformation to smoothed price locations relative to the high-low range of a specific period.

Fisher_m11_v1
Indicator

Fisher_m11_v1

This indicator quantifies price location within a defined range using logarithmic transformation and dual-layer smoothing to identify trend direction and momentum shifts.

Fisher_m11_v2
Indicator

Fisher_m11_v2

This indicator quantifies price position relative to the highest high and lowest low of a rolling window, applying logarithmic scaling and double smoothing to isolate directional momentum.

Fisher_m11_v3
Indicator

Fisher_m11_v3

This indicator quantifies price momentum by calculating the logarithmic ratio of smoothed relative price positions within a defined lookback range.

Indicator

Fisher_mbk

Indicator

Fisher_mbk_v1

Fisher_org_v1
Indicator

Fisher_org_v1

iMA

This indicator applies a logarithmic transformation to normalized price action to map unbounded price movements into a finite range for identifying momentum extremes.

Fisher_org_v12
Indicator

Fisher_org_v12

iMA

This indicator applies a Fisher Transform to the smoothed relative price position to linearize momentum extremes and identify trend reversals.

Fisher_org_v12_v1
Indicator

Fisher_org_v12_v1

iMA

This indicator applies a logarithmic transformation to the normalized price range and moving average spread to identify extreme momentum shifts and trend reversals.