Floor_Pivots_Session
Download script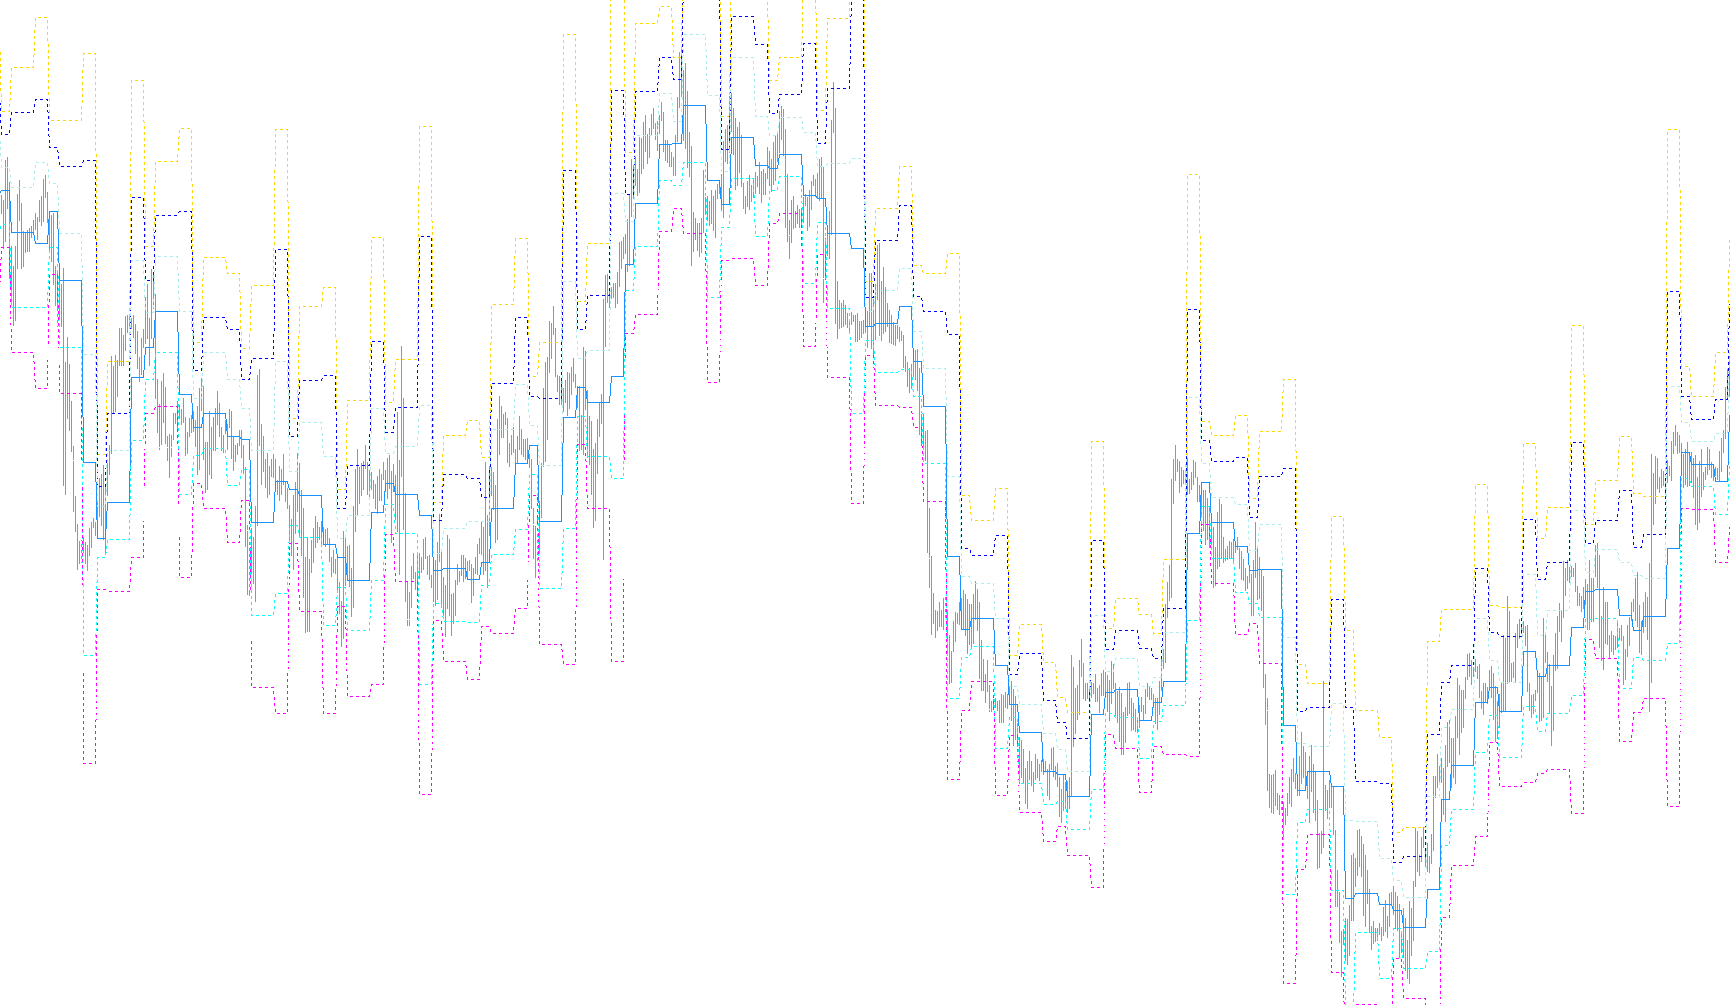
Overview of the Floor Pivots Session Tool
This tool is designed to automatically identify and display key price levels on your trading chart based on specific global market sessions. By recognizing these "Pivot Points," traders can better visualize potential support and resistance zones where price action might react or reverse.
Core Logic and Functionality
The script operates by dividing the trading day into three distinct geographical sessions: European, US, and Asian/Japanese. It uses user-defined start times for each of these regions to determine which market is currently active.
1. Session Recognition The tool constantly monitors the current time against your specified session settings. It identifies transitions between these markets (for example, when the European session ends and the US session begins).
2. Dynamic High/Low Tracking The primary logic of this script is its ability to "look back" at the preceding session to find critical price data. For every new session that begins, the tool scans the completed previous session to identify three essential pieces of information:
- The Highest price reached during that session.
- The Lowest price reached during that session.
- The Closing price of that session.
3. Mathematical Pivot Calculation Once it has captured the high, low, and close of the previous session, it calculates a series of "Floor Pivots." These are calculated using standard financial formulas:
- The Floor Pivot: The central baseline (the average of the High, Low, and Close).
- Resistance Levels (R1, R2, R3): Calculated as price targets above the Floor Pivot based on the volatility of the previous session.
- Support Levels (S1, S2, S3): Calculated as price floors below the Floor Pivot.
Visual Representation on Chart
The script automatically draws these levels as lines on your chart:
- Solid Lines: Represent the central "Floor Pivot" (the main equilibrium point).
- Dotted Lines: Represent the R1, R2, and S1, S2, S3 levels, providing a clear map of where significant price boundaries may exist.
Summary for the Trader
Instead of you having to manually calculate where the "ceiling" or "floor" of the previous market session was, this tool does the math instantly. It identifies the extremes of the previous session and projects them forward as support and resistance levels, allowing you to see potential trading zones at a glance as new sessions begin.
//+------------------------------------------------------------------+
//|                                         Floor_Pivots_Session.mq4 |
//|                         Copyright © 2008, kris.pivo[at]gmail.com |
//+------------------------------------------------------------------+
#property copyright " Kris, 2008 "
#property indicator_chart_window
#property indicator_buffers 7
#property indicator_color1 Green
#property indicator_color2 Green
#property indicator_color3 Green
#property indicator_color4 Silver
#property indicator_color5 Red
#property indicator_color6 Red
#property indicator_color7 Red

//---- input parameters
extern int EU_open =  1;    // Asian Session Open
extern int US_open =  8;    // European Session Open
extern int JP_open = 13;    // American Session Open

//---- buffers
double ExtMapBuffer1[];
double ExtMapBuffer2[];
double ExtMapBuffer3[];
double ExtMapBuffer4[];
double ExtMapBuffer5[];
double ExtMapBuffer6[];
double ExtMapBuffer7[];
int    DataPeriod;

//-----
int init()
  {
//---- indicators
   SetIndexStyle(0,DRAW_LINE, STYLE_DOT, 1);
   SetIndexBuffer(0,ExtMapBuffer1);
   SetIndexLabel(0,"Pivot R3");

   SetIndexStyle(1,DRAW_LINE, STYLE_DOT, 1);
   SetIndexBuffer(1,ExtMapBuffer2);
   SetIndexLabel(1,"Pivot R2");

   SetIndexStyle(2,DRAW_LINE, STYLE_DOT, 1);
   SetIndexBuffer(2,ExtMapBuffer3);
   SetIndexLabel(2,"Pivot R1");

   SetIndexStyle(3,DRAW_LINE, STYLE_SOLID, 1);
   SetIndexBuffer(3,ExtMapBuffer4);
   SetIndexLabel(3,"Floor Pivot");

   SetIndexStyle(4,DRAW_LINE, STYLE_DOT, 1);
   SetIndexBuffer(4,ExtMapBuffer5);
   SetIndexLabel(4,"Pivot S1");

   SetIndexStyle(5,DRAW_LINE, STYLE_DOT, 1);
   SetIndexBuffer(5,ExtMapBuffer6);
   SetIndexLabel(5,"Pivot S2");

   SetIndexStyle(6,DRAW_LINE, STYLE_DOT, 1);
   SetIndexBuffer(6,ExtMapBuffer7);
   SetIndexLabel(6,"Pivot S3");

   switch(Period())
      {
      case PERIOD_D1:  DataPeriod = 1;    break;
      case PERIOD_H4:  DataPeriod = 6;    break;
      case PERIOD_H1:  DataPeriod = 24;   break;
      case PERIOD_M30: DataPeriod = 48;   break;
      case PERIOD_M15: DataPeriod = 96;   break;
      case PERIOD_M5:  DataPeriod = 288;  break;
      case PERIOD_M1:  DataPeriod = 1440; break;
      }
   return(0);
  }
//------
int deinit()
  {
//------
   return(0);
  }
//------
int session(int i)
{
 int hour=TimeHour(iTime(NULL,0,i));
 int session=0;
      // find session....1=EU,2=US,3=JP

      if(EU_open < US_open)
      {
       if(hour>=EU_open && hour<US_open){session=1;}
      }
      else
      {
       if(hour>=EU_open || hour<US_open){session=1;}
      }
      if(US_open < JP_open)
      {
       if(hour>=US_open && hour<JP_open){session=2;}
      }
      else
      {
       if(hour>=US_open || hour<JP_open){session=2;}
      }
      if(JP_open < EU_open)
      {
       if(hour>=JP_open && hour<EU_open){session=3;}
      }
      else
      {
       if(hour>=JP_open || hour<EU_open){session=3;}
      }

 return(session);
 }

int start()
  {
     double PivotPoint;
     double PivR1, PivR2, PivR3, PivS1, PivS2, PivS3;
     int high,low,close;
     int startime,start,end,hour,cnt,session;
     int counted_bars=IndicatorCounted();
  //---- check for possible errors
     if(counted_bars<0) return(-1);
  //---- the last counted bar will be recounted
     int limit = Bars-counted_bars;
     if(limit>Bars-DataPeriod){limit=Bars-DataPeriod;}
  //---- main loop
     for (int i=limit; i >= 0; i--)
     {
      session=session(i);

     if(session==1)
     {
      for(cnt=i;session(cnt)!=2;cnt++)
      {
       if(session(cnt)==3)
       {
        if(session(cnt-1)==1)
        {
         close=cnt;
         high=cnt;
         low=cnt;
        }
        if(High[cnt]>High[high]){high=cnt;}
        if(Low[cnt]<Low[low]){low=cnt;}
       } } }

     if(session==2)
     {
      for(cnt=i;session(cnt)!=3;cnt++)
      {
       if(session(cnt)==1)
       {
        if(session(cnt-1)==2)
        {
         close=cnt;
         high=cnt;
         low=cnt;
        }
        if(High[cnt]>High[high]){high=cnt;}
        if(Low[cnt]<Low[low]){low=cnt;}
       } } }

     if(session==3)
     {
      for(cnt=i;session(cnt)!=1;cnt++)
      {
       if(session(cnt)==2)
       {
        if(session(cnt-1)==3)
        {
         close=cnt;
         high=cnt;
         low=cnt;
        }
        if(High[cnt]>High[high]){high=cnt;}
        if(Low[cnt]<Low[low]){low=cnt;}
       } } }

      PivotPoint=(High[high]+Low[low]+Close[close])/3.0;
      PivR3 = (2*PivotPoint)+(High[high]-(2*Low[low]));
      PivR2 = PivotPoint+(High[high] - Low[low]);
      PivR1 = (2*PivotPoint)-Low[low];
      PivS1 = (2*PivotPoint)-High[high];
      PivS2 = PivotPoint-(High[high] - Low[low]);
      PivS3 = (2*PivotPoint)-((2*High[high])-Low[low]);

      ExtMapBuffer1[i]=PivR3;
      ExtMapBuffer2[i]=PivR2;
      ExtMapBuffer3[i]=PivR1;
      ExtMapBuffer4[i]=PivotPoint;
      ExtMapBuffer5[i]=PivS1;
      ExtMapBuffer6[i]=PivS2;
      ExtMapBuffer7[i]=PivS3;
      }
    return(0);
    }
//+-+-+-+-+-+-+-+-+-+-+-+-+-+-+-+-+-+-+-+-+-+-+-+-+-+-+-+-+-+-+-+-+
Comments