FNCD
Download script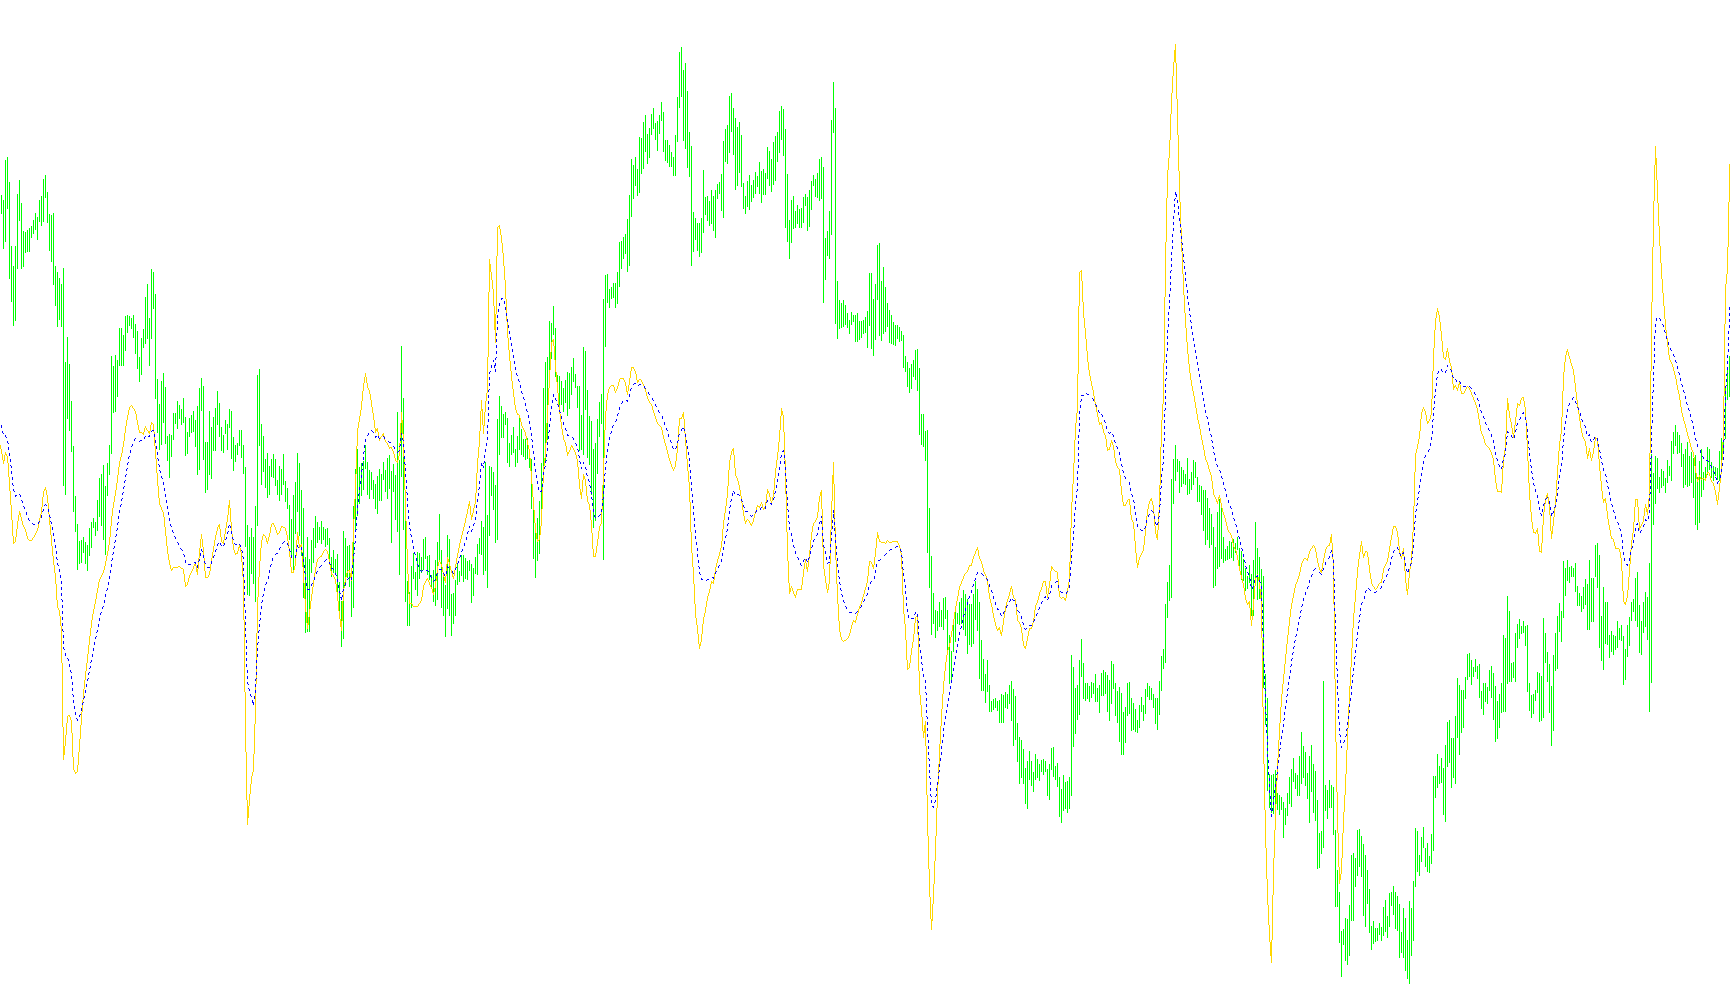
This technical indicator is designed to help traders identify price momentum and trend shifts by smoothing out market noise. It functions by transforming raw price data into a normalized format that highlights how far the current price is deviating from its average, then applies multiple layers of smoothing to produce clear visual signals.
How the Logic Works
1. Price Normalization The foundation of this script is a calculation that measures the distance between the current closing price and a simple moving average. Instead of looking at the raw price alone, it calculates how many "standard deviations" the price has moved away from that average. This effectively strips away the scale of the asset (whether you are trading pennies or thousands of dollars) to focus purely on the intensity of the move.
2. The Fisher Transformation Once the price deviation is calculated, the script applies a mathematical formula known as a "Fisher Transformation." This step is crucial because it constrains extreme price fluctuations into a readable range. It helps to linearize the data, making it easier to see when a trend is reaching a point of exhaustion or when a reversal is likely to occur.
3. Dual Exponential Smoothing After the initial transformation is complete, the script creates two distinct visual lines based on different speeds:
- The Fast Line: This tracks the normalized data very closely, reacting quickly to immediate changes in market momentum.
- The Slow Line: This follows the same data but uses a longer timeframe to smooth out minor fluctuations, providing a clearer picture of the broader trend.
How to Interpret the Results
The indicator appears in a separate window below your main price chart. By comparing the Fast and Slow lines against each other and the established horizontal levels (the "levels" mentioned in the settings), traders can observe:
- Momentum Shifts: When the Fast line crosses above or below the Slow line, it often indicates a change in the immediate direction of the trend.
- Overextended Moves: Because the data is normalized, the indicator helps identify when a move has become statistically significant compared to historical averages.
- Trend Strength: The distance between the two lines can provide a visual representation of how strongly the current market momentum is pushing in one direction.
//+------------------------------------------------------------------+
//|                                                         FNCD.mq4 |
//|                                                          Belomor |
//|                                                 belomor@inbox.ru |
//+------------------------------------------------------------------+
#property copyright "Belomor"
#property link      "belomor@inbox.ru"

#property indicator_separate_window
#property indicator_buffers 2
#property indicator_color1 Yellow
#property indicator_color2 Red
#property indicator_level1 1
#property indicator_level2 2
#property indicator_level3 -1
#property indicator_level4 -2
//---- input parameters
extern int       FN=34;
extern double    Deviation=3.0;
extern int       FastEMA=5;
extern int       SlowEMA=13;
//---- buffers
double ExtMapBuffer1[];
double ExtMapBuffer2[];
double ExtMapBuffer3[];
//+------------------------------------------------------------------+
//| Custom indicator initialization function                         |
//+------------------------------------------------------------------+
int init()
  {
//---- indicators
   IndicatorBuffers(3);
   SetIndexStyle(0,DRAW_LINE);
   SetIndexStyle(1,DRAW_LINE,STYLE_DOT);
   SetIndexBuffer(0,ExtMapBuffer1);
   SetIndexBuffer(1,ExtMapBuffer2);
   SetIndexBuffer(2,ExtMapBuffer3);
   if(FN<2)
   FN=2;
   if(Deviation<0)
   Deviation=1;
   if(FastEMA<1)
   FastEMA=1;
   if(SlowEMA<1)
   SlowEMA=1;
   IndicatorShortName("FNCD ("+FN+","+FastEMA+","+SlowEMA+")");
   SetIndexDrawBegin(0,FN+FastEMA);
   SetIndexDrawBegin(1,FN+SlowEMA);
   SetIndexLabel(0,"Fast FN");
   SetIndexLabel(1,"Slow FN");
   IndicatorDigits(4);
//----
   return(0);
  }

double NormalizedX(int F_period, int i)
   {
   double result;
   double A;
   double S;
   double C;
   if(i<Bars-F_period)
   {
   C=Close[i];
   A=iMA(NULL,0,F_period,0,MODE_SMA,PRICE_CLOSE,i);
   S=iStdDev(NULL,0,F_period,MODE_SMA,0,PRICE_CLOSE,i);
   result=(C-A)/S;
   }
   else
   result=0;
   return(result);
   }

double FisherNormalizedX(int F_period, double Dev, int i)
   {
   double result;
   double X;
   if(i<Bars-F_period && Dev>0)
   {
   X=NormalizedX(F_period,i)/Dev;
   if(X>0.99)
   X=0.99;
   if(X<-0.99)
   X=-0.99;
   result=0.5*MathLog((1+X)/(1-X));
   }
   else
   result=0;
   return(result);
   }

//+------------------------------------------------------------------+
//| Custom indicator iteration function                              |
//+------------------------------------------------------------------+
int start()
  {
   int limit;
   int counted_bars=IndicatorCounted();
//---- check for possible errors
   if(counted_bars<0) return(-1);
//---- last counted bar will be recounted
   if(counted_bars>0) counted_bars--;
   limit=Bars-counted_bars;
   for(int i=0; i<limit; i++)
      ExtMapBuffer3[i]=FisherNormalizedX(FN,Deviation,i);
   for(i=0; i<limit; i++)
      {
      ExtMapBuffer1[i]=iMAOnArray(ExtMapBuffer3,Bars,FastEMA,0,MODE_EMA,i);
      ExtMapBuffer2[i]=iMAOnArray(ExtMapBuffer3,Bars,SlowEMA,0,MODE_EMA,i);
      }
//---- done
   return(0);
  }
//+------------------------------------------------------------------+
Comments