FlatTrend_V2
Download script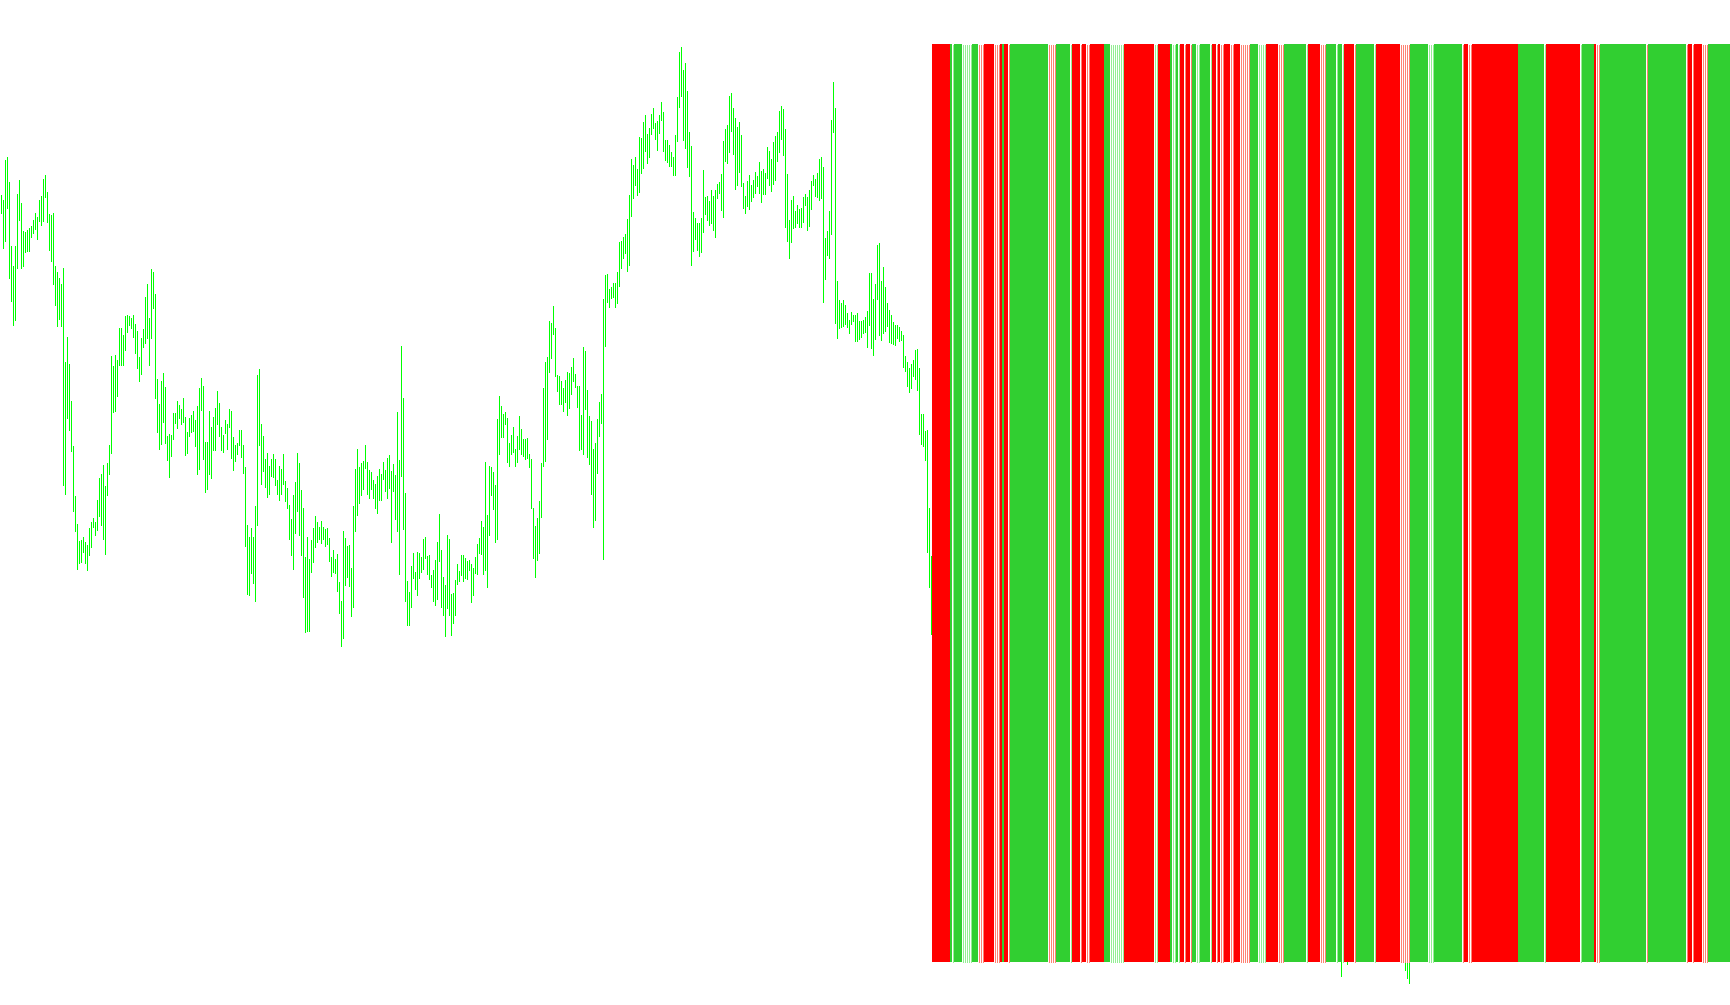
The FlatTrend indicator is a visual analysis tool designed to help traders identify and interpret market momentum by monitoring the relationship between price action, trend strength, and volatility. Rather than providing a cluttered chart of lines, it simplifies complex data into a clear histogram displayed in a separate window below your main trading chart.
How the Logic Works
The script operates by analyzing three distinct technical components simultaneously to determine the "mood" of the market:
- Trend Strength (ADX): The indicator looks at the Average Directional Index (ADX) to measure how strong a current trend is. It compares the present strength against the previous period to see if momentum is accelerating or slowing down.
- Price Positioning (Parabolic SAR): It monitors the Parabolic Stop and Reverse (SAR) values, which act as dynamic markers for potential price reversals. By comparing where the actual market price sits in relation to these markers, the tool can identify whether the price is currently "over-extended" or "pulling back."
- Timeframe Coordination: You can customize the logic to run on specific intervals (such as 5 minutes, 1 hour, or daily), allowing you to see the trend data relevant to your specific trading style.
Visual Interpretation
The indicator translates these three components into four distinct colored histograms:
- Bullish Momentum: When the price is positioned above the reversal markers and the trend strength is increasing, the tool signals a positive momentum flow.
- Bearish Momentum: Conversely, when the price falls below those markers while the trend strength shows a downward push, it highlights a negative momentum flow.
- Neutral/Transition Zones: The logic also accounts for "mixed" signals—scenarios where the price might be moving in one direction, but the underlying strength is weakening (or vice versa). These are displayed in different colors to warn traders of potential exhaustion or trend reversals.
Summary for the User
Essentially, FlatTrend filters out the "noise" of a busy chart. It looks at the market and asks: "Is the price moving with strength, or is it getting tired?" By displaying this as a histogram, it allows you to see at a glance whether the current move has enough "fuel" to continue or if the market is entering a flat, sideways, or reversing phase.
//+------------------------------------------------------------------+
//|                                                    FlatTrend.mq4 |
//|                                                       Kirk Sloan |
//|                                        http://www.metaquotes.net |
//+------------------------------------------------------------------+
#property copyright "Kirk Sloan"
#property link      "http://www.metaquotes.net"
//----
#property indicator_separate_window
#property indicator_minimum 0
#property indicator_maximum 1
#property indicator_buffers 4
#property indicator_color1 Red
#property indicator_color2 LimeGreen
#property indicator_color3 Gold
//---- input parameters
extern int       Minutes=5;
//---- buffers
double ExtMapBuffer1[];
double ExtMapBuffer2[];
double ExtMapBuffer3[];
double ExtMapBuffer4[];
double Ma;
double hhigh, llow;
double Psar;
double PADX,NADX;
string TimeFrameStr;
//+------------------------------------------------------------------+
//| Custom indicator initialization function                         |
//+------------------------------------------------------------------+
int init()
  {
//---- indicators
   SetIndexStyle(0,DRAW_HISTOGRAM,STYLE_SOLID,2,Red);
   SetIndexBuffer(0,ExtMapBuffer1);
   SetIndexStyle(1,DRAW_HISTOGRAM,STYLE_SOLID,2, LimeGreen);
   SetIndexBuffer(1,ExtMapBuffer2);
   SetIndexStyle(2,DRAW_HISTOGRAM,STYLE_SOLID,1, Salmon);
   SetIndexBuffer(2,ExtMapBuffer3);
   SetIndexStyle(3,DRAW_HISTOGRAM,STYLE_SOLID,1, LightGreen);
   SetIndexBuffer(3,ExtMapBuffer4);
   switch(Minutes)
     {
      case 1 : TimeFrameStr="Period_M1"; break;
      case 5 : TimeFrameStr="Period_M5"; break;
      case 15 : TimeFrameStr="Period_M15"; break;
      case 30 : TimeFrameStr="Period_M30"; break;
      case 60 : TimeFrameStr="Period_H1"; break;
      case 240 : TimeFrameStr="Period_H4"; break;
      case 1440 : TimeFrameStr="Period_D1"; break;
      case 10080 : TimeFrameStr="Period_W1"; break;
      case 43200 : TimeFrameStr="Period_MN1"; break;
      default : TimeFrameStr="Current Timeframe"; Minutes=0;
     }
   IndicatorShortName("Flat Trend ("+TimeFrameStr+")");
//----
   return(0);
  }
//+------------------------------------------------------------------+
//| Custom indicator deinitialization function                       |
//+------------------------------------------------------------------+
int deinit()
  {
//----
//----
   return(0);
  }
//+------------------------------------------------------------------+
//| Custom indicator iteration function                              |
//+------------------------------------------------------------------+
int start()
  {
   int    counted_bars=IndicatorCounted();
//----
     for(int i=0; i < 400; i++)
     {
      ExtMapBuffer1[i]=0;
      ExtMapBuffer2[i]=0;
      ExtMapBuffer3[i]=0;
      ExtMapBuffer4[i]=0;
//----
      PADX=iADX(NULL,Minutes,14 ,PRICE_CLOSE,1,i);
      NADX=iADX(NULL,Minutes,14 ,PRICE_CLOSE,2,i);
//----
      Psar=iSAR(NULL,Minutes,0.02,0.2,i) ;
        if (Psar < iClose(NULL, Minutes,i) && PADX > NADX)
        {
         ExtMapBuffer2[i]=1;
        }
        if (Psar < iClose(NULL, Minutes,i) && NADX > PADX)
        {
         ExtMapBuffer4[i]=1;
        }
        if (Psar > iClose(NULL, Minutes,i) && NADX > PADX)
        {
         ExtMapBuffer1[i]=1;
        }
        if (Psar > iClose(NULL, Minutes,i) && PADX > NADX)
        {
         ExtMapBuffer3[i]=1;
        }
        if (ExtMapBuffer1[i]==0 && ExtMapBuffer2[i]==0)
        {
         //ExtMapBuffer3[i] = 1;
        }
     }
//----
   return(0);
  }
//+------------------------------------------------------------------+
Comments