FLOW
Download script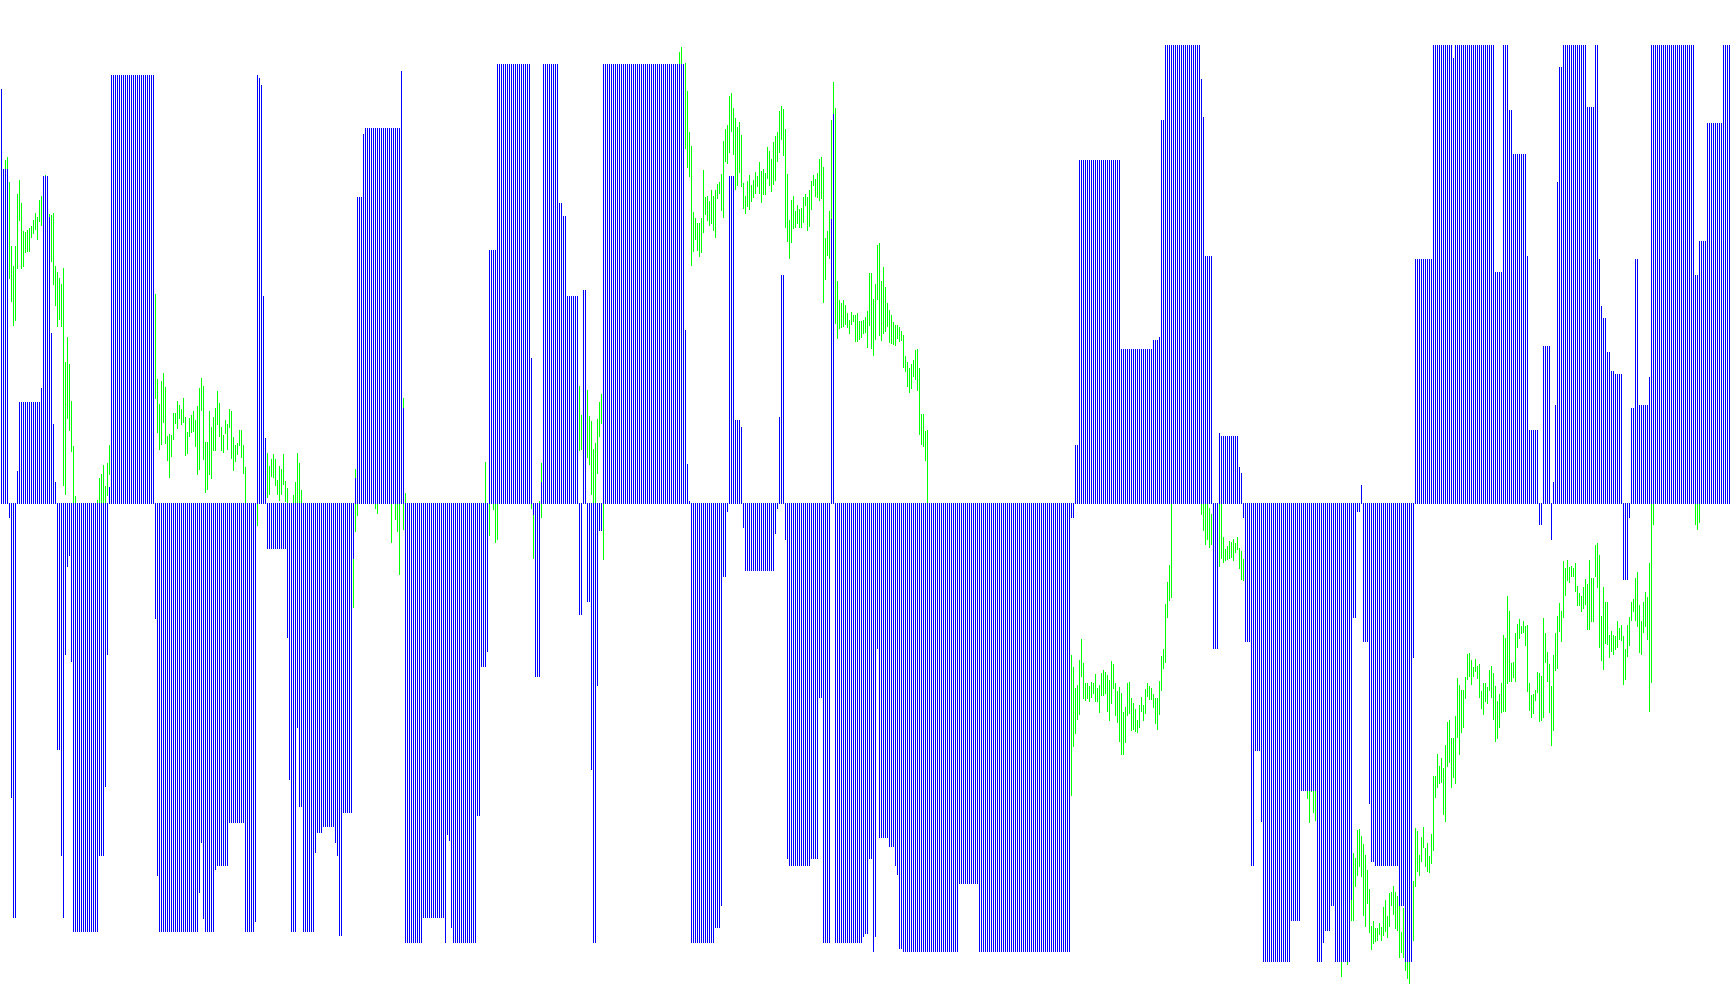
This tool is designed to help traders visualize market momentum and price trends by analyzing the "flow" of price movement. Rather than simply looking at where the price is, it calculates how much volatility is occurring over a specific timeframe and uses that data to identify three different levels of trend intensity.
How the Logic Works
1. Volatility Measurement (The "Flow") The script begins by measuring market activity over a user-defined period. It looks at the difference between highs and lows, applying a weighted calculation where more recent price action carries more significance. This allows the tool to establish a "Step Size"—essentially a dynamic measurement of how much the price typically moves in the current environment.
2. Three-Tier Trend Identification Based on these volatility measurements, the script calculates three distinct trend boundaries:
- Minimum: A tight, sensitive range that captures small movements.
- Maximum: A wide, broad range that identifies major market shifts.
- Mid (Average): A balanced range sitting between the two extremes.
By comparing the current closing price against these three different "steps," the script can determine if the market is trending upward or downward across different scales of intensity.
3. Price Progression and Memory The script doesn't just look at a single moment in time; it carries over information from previous bars. If a trend is established (for example, an upward move), the logic ensures that the "step" boundaries maintain their integrity as long as the trend continues. This prevents the indicator from reacting too wildly to minor, insignificant price flickers, focusing instead on sustained movement.
4. Momentum Conversion Once these three trend levels are established, the script performs a final conversion:
- It calculates the distance between the Minimum trend and the Mid trend.
- This distance is converted into a percentage-based signal (the "Signal").
- Finally, it applies a momentum calculation to this signal to smooth out any noise.
What you see on your chart
The final output provides two main visual components:
- A Histogram: This represents the primary difference between the sensitive and average trend levels, showing you the immediate "flow" of the market.
- A Momentum Line: This is a smoothed version of that flow, helping you identify the strength and direction of the current trend with less visual "jitter."
In short, the logic takes raw price volatility, calculates three different ways to measure "steps" in that volatility, and compares them to show you how strongly the current price is pushing against the established market flow.
//+------------------------------------------------------------------+
//|                                              StepMA_Stoch_v1.mq4 |
//|                           Copyright © 2005, TrendLaboratory Ltd. |
//|                                       E-mail: igorad2004@list.ru |
//+------------------------------------------------------------------+
#property copyright "Copyright © 2005, TrendLaboratory Ltd."
#property link      "E-mail: igorad2004@list.ru"

#property indicator_separate_window
#property indicator_buffers 2
#property indicator_color1 LightGreen
#property indicator_color2 Gold
#property indicator_minimum -25
#property indicator_maximum 25

//---- input parameters
extern int PeriodWATR=10;
extern double Kwatr=1.0000;
extern int HighLow=0;

//---- indicator buffers
double LineMinBuffer[];
double LineMidBuffer[];
double stepSignalBuffer[];
double momBuffer[];

//+------------------------------------------------------------------+
//| Custom indicator initialization function                         |
//+------------------------------------------------------------------+
  int init() {
   string short_name;
//---- indicator line
   //SetIndexStyle(0,DRAW_LINE,STYLE_SOLID, 1);
   //SetIndexStyle(1,DRAW_LINE,STYLE_SOLID, 1);
   SetIndexStyle(1,DRAW_HISTOGRAM, STYLE_SOLID, 1);
   SetIndexStyle(2,DRAW_LINE,STYLE_SOLID, 1);
   //SetIndexBuffer(0, LineMinBuffer);
   //SetIndexBuffer(1, LineMidBuffer);
   SetIndexBuffer(1, stepSignalBuffer);
   SetIndexBuffer(2, momBuffer);

   IndicatorDigits(MarketInfo(Symbol(),MODE_DIGITS));
//---- name for DataWindow and indicator subwindow label
   short_name="FLOW ("+PeriodWATR+","+Kwatr+","+HighLow+")";
   IndicatorShortName(short_name);
   //SetIndexLabel(0,"StepMA Stoch 1");
   //SetIndexLabel(1,"StepMA Stoch 2");
   SetIndexLabel(1,"StepMA Hist");
   SetIndexLabel(2,"StepMA Mom");
//----
   //SetIndexDrawBegin(0,PeriodWATR);
   //SetIndexDrawBegin(1,PeriodWATR);
   SetIndexDrawBegin(1,PeriodWATR);
   SetIndexDrawBegin(2,PeriodWATR);
//----
   return(0);
  }

//+------------------------------------------------------------------+
//| StepMA_3D_v1                                                         |
//+------------------------------------------------------------------+
int start() {
   int      i,shift,TrendMin,TrendMax,TrendMid;
   double   SminMin0,SmaxMin0,SminMin1,SmaxMin1,SumRange,dK,WATR0,WATRmax,WATRmin,WATRmid;
   double   SminMax0,SmaxMax0,SminMax1,SmaxMax1,SminMid0,SmaxMid0,SminMid1,SmaxMid1;
   double   linemin,linemax,linemid,Stoch1,Stoch2,bsmin,bsmax;

   for(shift=Bars-1;shift>=0;shift--)
   {
	SumRange=0;
	for (i=PeriodWATR-1;i>=0;i--)
	    {
       dK = 1+1.0*(PeriodWATR-i)/PeriodWATR;
       SumRange+= dK*MathAbs(High[i+shift]-Low[i+shift]);
       }
	WATR0 = SumRange/PeriodWATR;

	WATRmax=MathMax(WATR0,WATRmax);
	if (shift==Bars-1-PeriodWATR) WATRmin=WATR0;
	WATRmin=MathMin(WATR0,WATRmin);

	int StepSizeMin=MathRound(Kwatr*WATRmin/Point);
	int StepSizeMax=MathRound(Kwatr*WATRmax/Point);
	int StepSizeMid=MathRound(Kwatr*0.5*(WATRmax+WATRmin)/Point);

	if (HighLow>0) {
	  SmaxMin0=Low[shift]+2*StepSizeMin*Point;
	  SminMin0=High[shift]-2*StepSizeMin*Point;

	  SmaxMax0=Low[shift]+2*StepSizeMax*Point;
	  SminMax0=High[shift]-2*StepSizeMax*Point;

	  SmaxMid0=Low[shift]+2*StepSizeMid*Point;
	  SminMid0=High[shift]-2*StepSizeMid*Point;

	  if(Close[shift]>SmaxMin1) TrendMin=1;
	  if(Close[shift]<SminMin1) TrendMin=-1;

	  if(Close[shift]>SmaxMax1) TrendMax=1;
	  if(Close[shift]<SminMax1) TrendMax=-1;

	  if(Close[shift]>SmaxMid1) TrendMid=1;
	  if(Close[shift]<SminMid1) TrendMid=-1;
	}

	if (HighLow == 0) {
	  SmaxMin0=Close[shift]+2*StepSizeMin*Point;
	  SminMin0=Close[shift]-2*StepSizeMin*Point;

	  SmaxMax0=Close[shift]+2*StepSizeMax*Point;
	  SminMax0=Close[shift]-2*StepSizeMax*Point;

	  SmaxMid0=Close[shift]+2*StepSizeMid*Point;
	  SminMid0=Close[shift]-2*StepSizeMid*Point;

	  if(Close[shift]>SmaxMin1) TrendMin=1;
	  if(Close[shift]<SminMin1) TrendMin=-1;

	  if(Close[shift]>SmaxMax1) TrendMax=1;
	  if(Close[shift]<SminMax1) TrendMax=-1;

	  if(Close[shift]>SmaxMid1) TrendMid=1;
	  if(Close[shift]<SminMid1) TrendMid=-1;
	  }

	  if(TrendMin>0 && SminMin0<SminMin1) SminMin0=SminMin1;
	  if(TrendMin<0 && SmaxMin0>SmaxMin1) SmaxMin0=SmaxMin1;

	  if(TrendMax>0 && SminMax0<SminMax1) SminMax0=SminMax1;
	  if(TrendMax<0 && SmaxMax0>SmaxMax1) SmaxMax0=SmaxMax1;

	  if(TrendMid>0 && SminMid0<SminMid1) SminMid0=SminMid1;
	  if(TrendMid<0 && SmaxMid0>SmaxMid1) SmaxMid0=SmaxMid1;


	  if (TrendMin>0) linemin=SminMin0+StepSizeMin*Point;
	  if (TrendMin<0) linemin=SmaxMin0-StepSizeMin*Point;

	  if (TrendMax>0) linemax=SminMax0+StepSizeMax*Point;
	  if (TrendMax<0) linemax=SmaxMax0-StepSizeMax*Point;

	  if (TrendMid>0) linemid=SminMid0+StepSizeMid*Point;
	  if (TrendMid<0) linemid=SmaxMid0-StepSizeMid*Point;

	  bsmin=linemax-StepSizeMax*Point;
	  bsmax=linemax+StepSizeMax*Point;
	  Stoch1=(linemin-bsmin)/(bsmax-bsmin);
	  Stoch2=(linemid-bsmin)/(bsmax-bsmin);

	  LineMinBuffer[shift]=Stoch1;
	  LineMidBuffer[shift]=Stoch2;
	  stepSignalBuffer[shift]=(Stoch1-Stoch2)*100;
	  momBuffer[shift]= iMomentumOnArray(stepSignalBuffer, ArraySize(stepSignalBuffer), 13, 0);


	  SminMin1=SminMin0;
	  SmaxMin1=SmaxMin0;

	  SminMax1=SminMax0;
	  SmaxMax1=SmaxMax0;

	  SminMid1=SminMid0;
	  SmaxMid1=SmaxMid0;
	}

	return(0);
 }
Comments