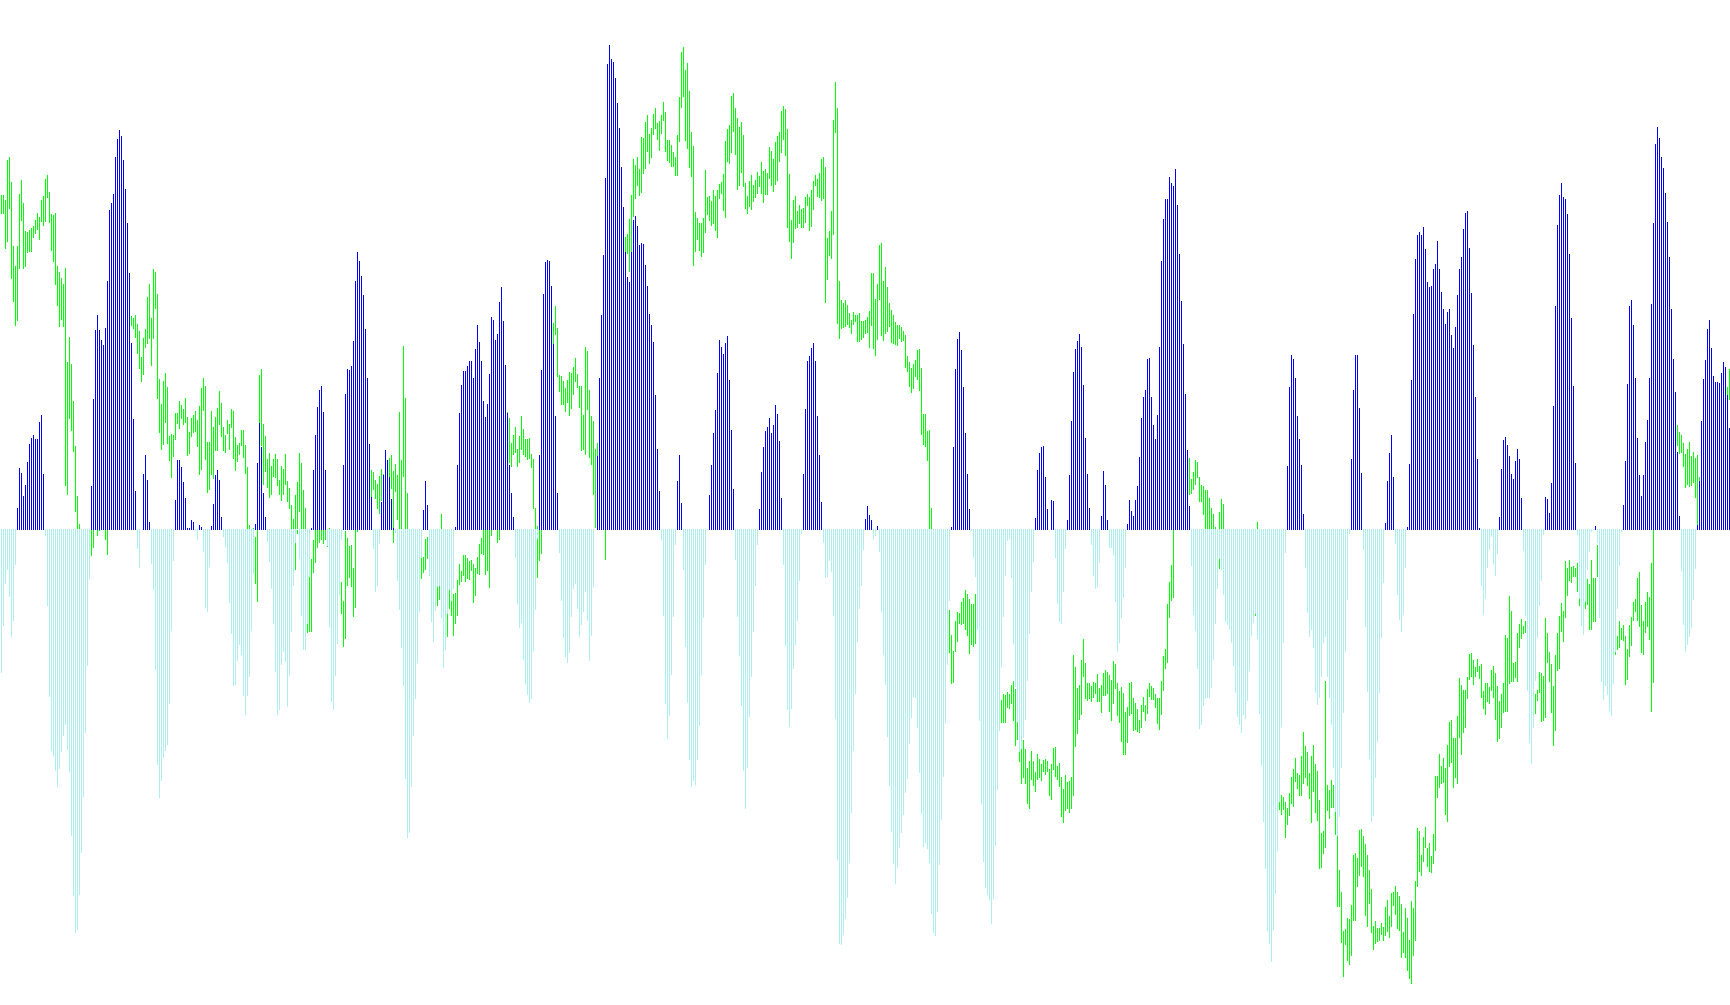
This tool is designed as a visual aid for traders to identify momentum and trend directions on a financial chart. It functions by analyzing price action over a specific timeframe to produce a smoothed, oscillating indicator that highlights where the market's "energy" is heading.
Core Logic and Mechanism
1. Data Collection and Normalization The script begins by looking at a set window of recent price data (defined by the user as a period). It identifies the highest high and the lowest low within that timeframe. By comparing the current middle price against these extremes, the tool calculates the relative position of the market. Essentially, it determines whether the price is currently leaning toward the top or the bottom of its recent range.
2. Smoothing and Weighted Analysis Rather than reacting sharply to every tiny flicker in price, the tool uses a weighted smoothing calculation. It blends the current price position with previous data points to create a more stable trend line. This filtering process helps eliminate "noise"—the small, erratic movements that can often mislead inexperienced traders—providing a clearer picture of the underlying direction.
3. Logarithmic Transformation To make the visual representation more accurate for trading purposes, the tool applies a logarithmic calculation to the smoothed values. This translates the raw price movement into an oscillating wave, making it easier to see the intensity of the momentum.
4. Trend Categorization (The Visual Output) The most practical feature for the user is how the script separates "Up" trends from "Down" trends:
- Positive Momentum: When the calculated value remains above zero, the tool identifies an upward trend and paints it in a specific color (Lime).
- Negative Momentum: When the calculated value drops below zero, the tool identifies a downward trend and paints it in a different color (Red).
- Visual Clarity: By using a histogram style, the script provides a clear visual "block" of color. This allows traders to see at a glance whether the current market environment is bullish or bearish without having to interpret complex raw numbers.
Summary for the User
In simple terms, this script acts as a momentum filter. It looks at the recent high and low prices, smooths out the fluctuations, and projects them onto a separate window below your chart. It tells you: "Based on recent price history, is the current momentum pushing upward or downward?" By highlighting these zones in contrasting colors, it helps you visualize the strength of the trend more clearly than by looking at the raw candles alone.
#property  copyright "Copyright © 2005, Yura Prokofiev"
#property  link      "Yura.prokofiev@gmail.com"

#property  indicator_separate_window
#property  indicator_buffers 3
#property  indicator_color1  Yellow
#property  indicator_color2  Lime
#property  indicator_color3  Red

extern int period=10;

double         ExtBuffer0[];
double         ExtBuffer1[];
double         ExtBuffer2[];


int init()
  {


   SetIndexStyle(0,DRAW_NONE);
   SetIndexStyle(1,DRAW_HISTOGRAM);
   SetIndexStyle(2,DRAW_HISTOGRAM);
   IndicatorDigits(Digits+1);

   SetIndexBuffer(0,ExtBuffer0);
   SetIndexBuffer(1,ExtBuffer1);
   SetIndexBuffer(2,ExtBuffer2);

   IndicatorShortName("Fisher_Yur4ik");
   SetIndexLabel(1,NULL);
   SetIndexLabel(2,NULL);

   return(0);
  }


int start()
  {
   //int     period=10;
   int    limit;
   int    counted_bars=IndicatorCounted();
   double prev,current,old;
   double Value=0,Value1=0,Value2=0,Fish=0,Fish1=0,Fish2=0;
   double price;
   double MinL=0;
   double MaxH=0;


   if(counted_bars>0) counted_bars--;
   limit=Bars-counted_bars;


   for(int i=0; i<limit; i++)
    {  MaxH = High[Highest(NULL,0,MODE_HIGH,period,i)];
       MinL = Low[Lowest(NULL,0,MODE_LOW,period,i)];
      price = (High[i]+Low[i])/2;
      Value = 0.33*2*((price-MinL)/(MaxH-MinL)-0.5) + 0.67*Value1;
      Value=MathMin(MathMax(Value,-0.999),0.999);
      ExtBuffer0[i]=0.5*MathLog((1+Value)/(1-Value))+0.5*Fish1;
      Value1=Value;
      Fish1=ExtBuffer0[i];

    }


   bool up=true;
   for(i=limit-2; i>=0; i--)
     {
      current=ExtBuffer0[i];
      prev=ExtBuffer0[i+1];

      if (((current<0)&&(prev>0))||(current<0))   up= false;
      if (((current>0)&&(prev<0))||(current>0))   up= true;

      if(!up)
        {
         ExtBuffer2[i]=current;
         ExtBuffer1[i]=0.0;
        }

       else
         {
          ExtBuffer1[i]=current;
          ExtBuffer2[i]=0.0;
         }
     }

   return(0);
  }
Comments