Fisher_Yur4ik_Alert
Download script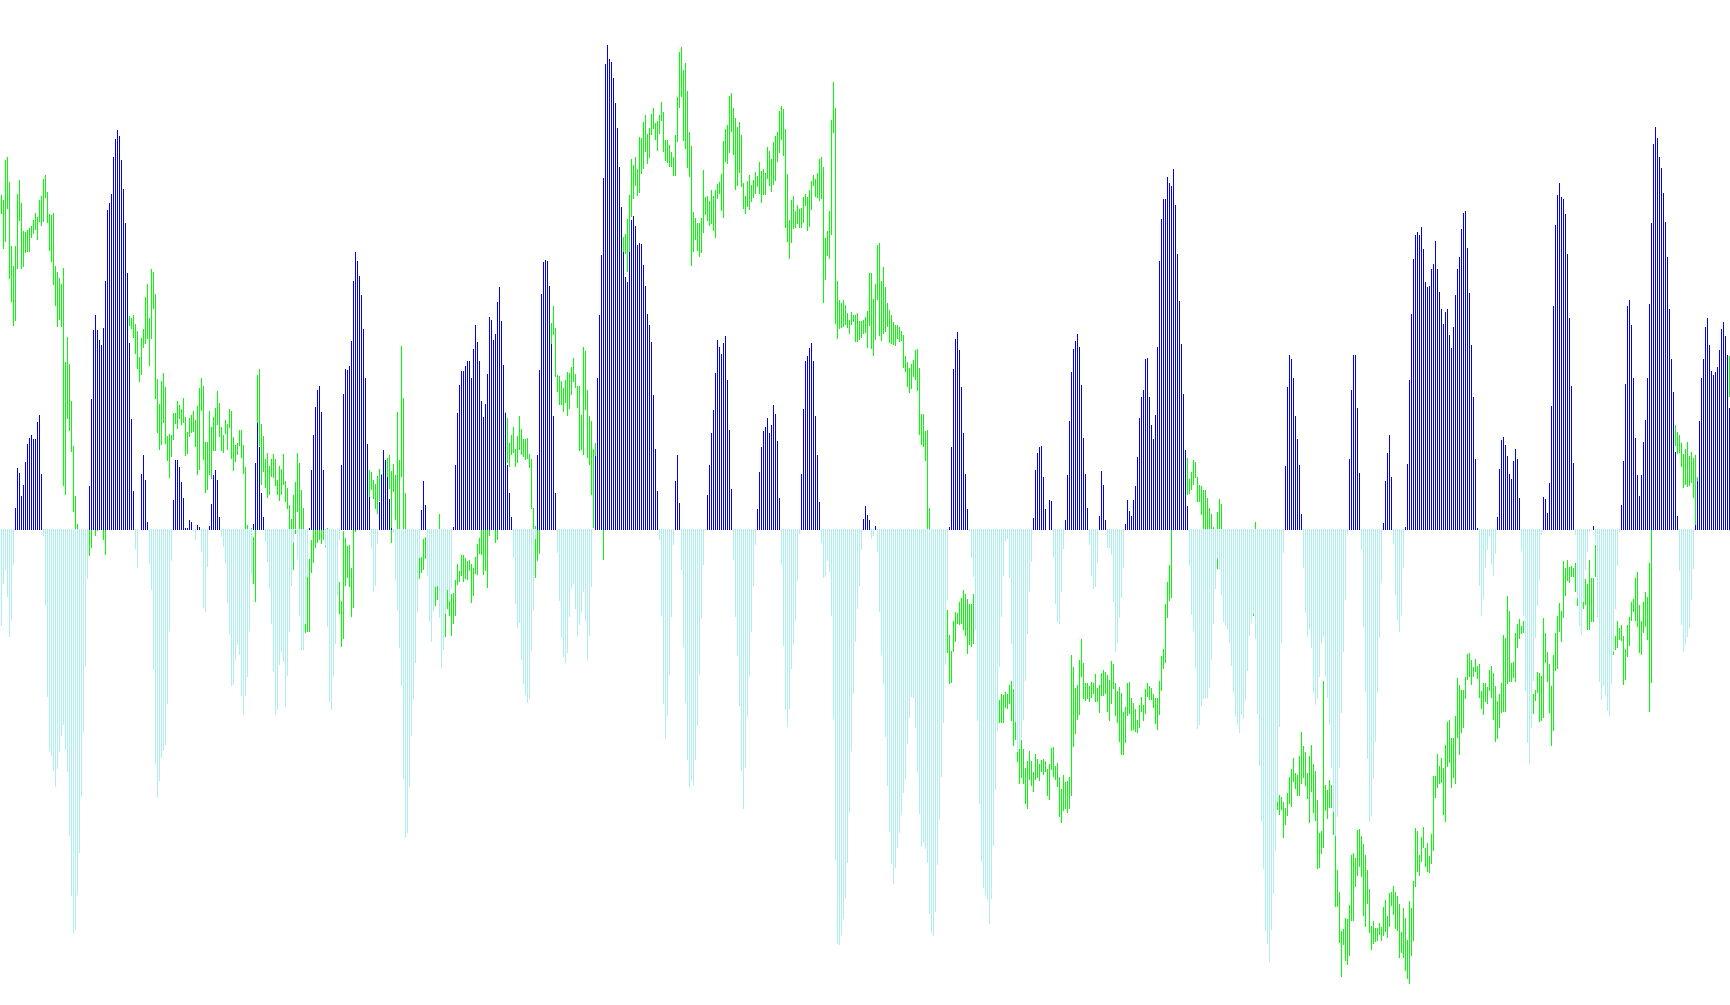
This technical indicator is designed to provide visual cues for market momentum by analyzing price fluctuations over a specific period. It transforms raw price data into a smoothed movement profile, helping traders identify shifts between upward and downward trends.
Core Logic and Mechanics
Price Normalization and Smoothing The script begins by scanning the highest highs and lowest lows over a user-defined number of candles (the "period"). By comparing the current price to these extremes, it calculates a normalized value representing where the price sits within its recent range. This value is then subjected to a weighted smoothing calculation—blending the current movement with previous data—to filter out minor market noise and reveal the underlying trend.
Momentum Transformation The smoothed data is processed through a logarithmic calculation. This step serves to amplify the sensitivity of the indicator, making it more responsive to significant price changes while maintaining a fluid curve. The result is a single line that moves above and below a zero baseline:
- Above Zero: Indicates positive momentum.
- Below Zero: Indicates negative momentum.
Trend Visualization (Histogram) Instead of just showing a simple line, the script converts this data into a dual-colored histogram. It tracks the "state" of the market:
- When the indicator is in a positive state, it highlights the data in one color (Lime).
- When the indicator enters a negative state, it switches to another color (Red).
Alert System and Signal Detection The logic includes an automated detection system for "crosses." Whenever the indicator line crosses the zero baseline—moving from positive to negative or vice versa—the script triggers an audible alert. This signifies a potential reversal in momentum.
Essentially, this tool acts as a momentum filter, translating complex price volatility into a clear, color-coded visual history that highlights when the market sentiment shifts from bullish to bearish.
#property  copyright "Copyright © 2005, Yura Prokofiev"
#property  link      "Yura.prokofiev@gmail.com"

#property  indicator_separate_window
#property  indicator_buffers 3
#property  indicator_color1  Black
#property  indicator_color2  Lime
#property  indicator_color3  Red

extern int period=10;
extern string AlertFileName = "alert.wav";

double         ExtBuffer0[];
double         ExtBuffer1[];
double         ExtBuffer2[];


int init()
  {


   SetIndexStyle(0,DRAW_NONE);
   SetIndexStyle(1,DRAW_HISTOGRAM);
   SetIndexStyle(2,DRAW_HISTOGRAM);
   IndicatorDigits(Digits+1);

   SetIndexBuffer(0,ExtBuffer0);
   SetIndexBuffer(1,ExtBuffer1);
   SetIndexBuffer(2,ExtBuffer2);

   IndicatorShortName("Fisher_Yur4ik");
   SetIndexLabel(1,NULL);
   SetIndexLabel(2,NULL);

   return(0);
  }


int start()
  {
   //int     period=10;
   int    limit;
   int    counted_bars=IndicatorCounted();
   double prev,current,old;
   double Value=0,Value1=0,Value2=0,Fish=0,Fish1=0,Fish2=0;
   double price;
   double MinL=0;
   double MaxH=0;


   if(counted_bars>0) counted_bars--;
   limit=Bars-counted_bars;


   for(int i=0; i<limit; i++)
    {  MaxH = High[Highest(NULL,0,MODE_HIGH,period,i)];
       MinL = Low[Lowest(NULL,0,MODE_LOW,period,i)];
      price = (High[i]+Low[i])/2;
      Value = 0.33*2*((price-MinL)/(MaxH-MinL)-0.5) + 0.67*Value1;
      Value=MathMin(MathMax(Value,-0.999),0.999);
      ExtBuffer0[i]=0.5*MathLog((1+Value)/(1-Value))+0.5*Fish1;
      Value1=Value;
      Fish1=ExtBuffer0[i];

    }


   bool up=true;
   for(i=limit-2; i>=0; i--)
     {
      current=ExtBuffer0[i];
      prev=ExtBuffer0[i+1];

      if (((current<0)&&(prev>0))||(current<0))   up= false;
      if (((current>0)&&(prev<0))||(current>0))   up= true;

      if ((current<0)&&(prev>0))
         {
         PlaySound(AlertFileName);
         }
      if ((current>0)&&(prev<0))
         {
         PlaySound(AlertFileName);
         }

      if(!up)
        {
         ExtBuffer2[i]=current;
         ExtBuffer1[i]=0.0;
        }

       else
         {
          ExtBuffer1[i]=current;
          ExtBuffer2[i]=0.0;
         }
     }

   return(0);
  }
Comments