Fisher_Yur4ik_Correct_v1
Download script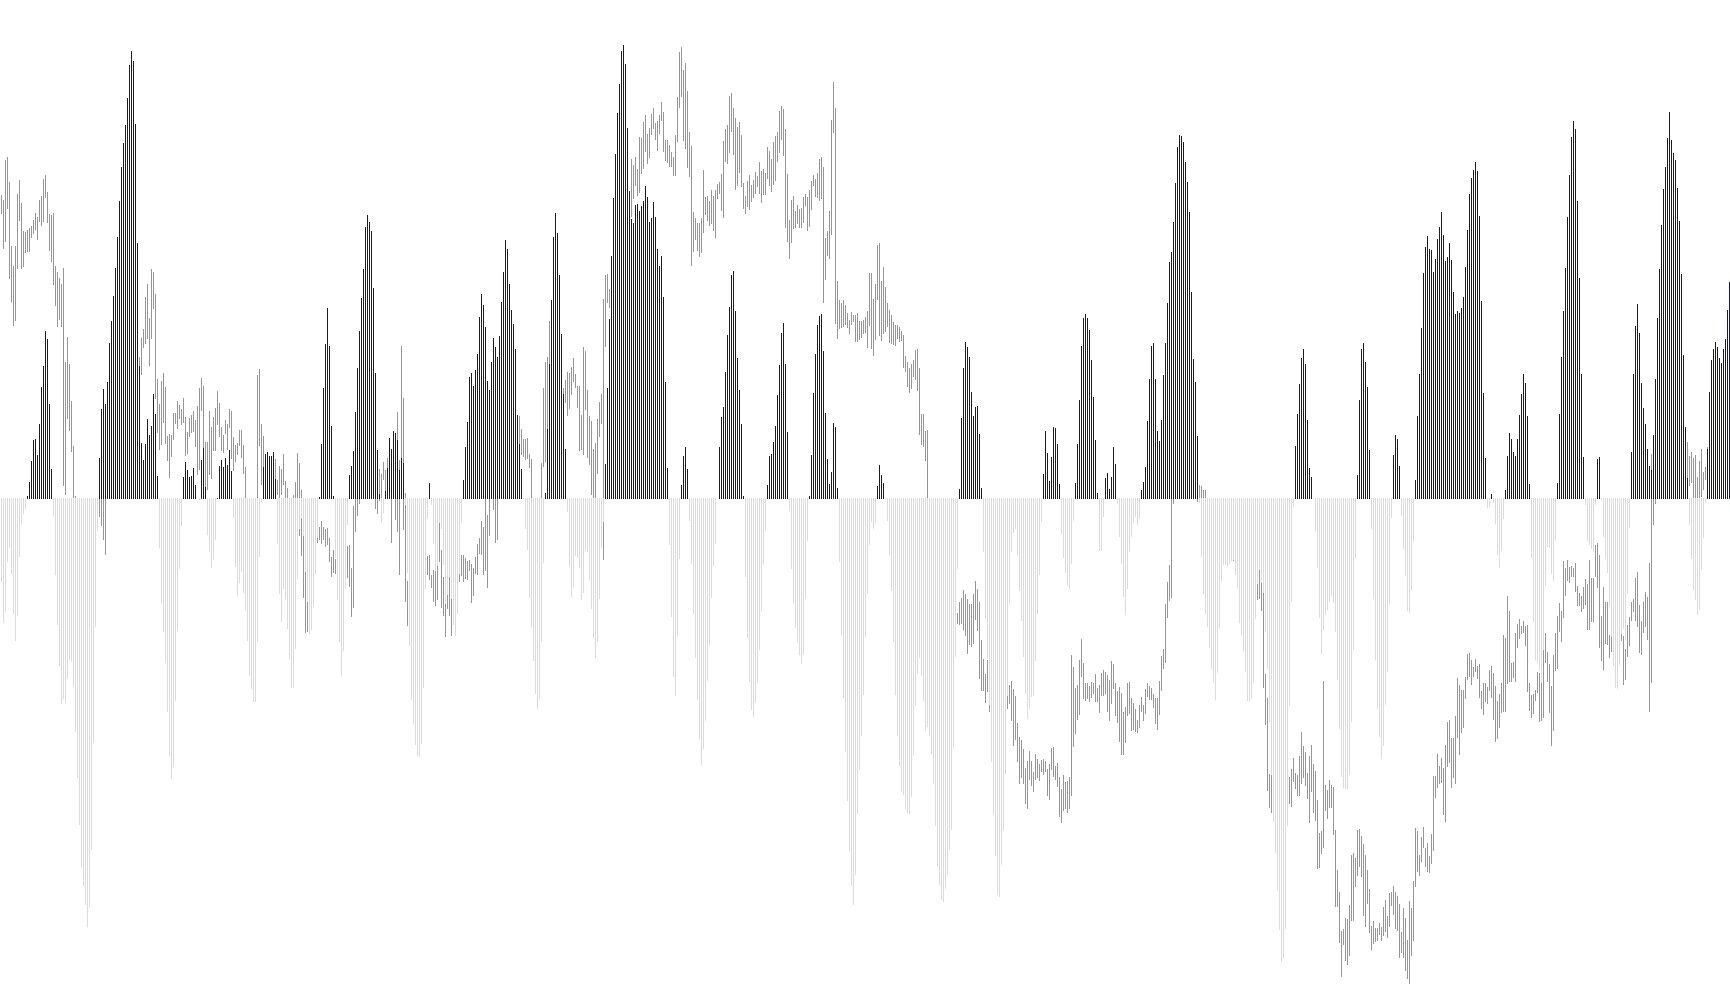
This tool is designed as a visual momentum indicator for trading platforms, specifically created to help traders identify the direction and strength of price movements. Rather than looking at raw price action alone, it processes historical data to smooth out "noise" and highlight overarching trends.
Core Logic and Functionality
The script operates through three primary stages of calculation:
1. Price Range Analysis The indicator begins by scanning a specific number of past price bars (based on a user-defined period). It identifies the highest peak and the lowest valley within that timeframe. By comparing the current middle price to these extremes, it determines where the price sits relative to its recent range.
2. Momentum Calculation (Smoothing) Once the relative position of the price is found, the script applies a weighted formula to calculate momentum. This step acts as a "filter"—it takes a portion of the new data and blends it with the previous values. This ensures that the resulting movement is fluid rather than jagged, preventing the indicator from reacting too wildly to tiny, insignificant price fluctuations.
3. Logarithmic Transformation To make the momentum easier to read, the script applies a logarithmic calculation. This helps normalize the data, making it more effective at showcasing acceleration or deceleration in a way that aligns with how traders perceive market velocity.
Visual Interpretation
The tool provides a clear visual distinction between "Up" and "Down" trends using a histogram format:
- Trend Tracking: The logic constantly compares the current momentum value against the previous one. If the momentum shifts from positive to negative (or vice versa), the indicator recognizes a change in trend direction.
- Dynamic Highlighting:
- When the momentum is trending upward, it highlights the data in one color (Lime), signaling bullish sentiment.
- When the momentum turns downward, it switches to another color (Red), signaling bearish sentiment.
- Reference Levels: The indicator uses fixed horizontal levels (-0.25 and 0.25) as boundaries, helping users quickly identify when momentum is moving into significant territory or potentially reaching an extreme.
Summary for the User
In short, this script takes raw market volatility and transforms it into a smooth, color-coded flow. It tells you not just what the price is doing right now, but the underlying "force" behind the movement, making it easier to see when a trend is gaining strength or beginning to lose steam.
/*-----------------------------+
|			       |
| Shared by www.Aptrafx.com    |
|			       |
+------------------------------*/

#property  copyright "Copyright © 2005, Yura Prokofiev"
#property  link      "Yura.prokofiev@gmail.com"

#property  indicator_separate_window
#property  indicator_buffers 3
#property  indicator_color1  Blue
#property  indicator_color2  Lime
#property  indicator_color3  Red
#property indicator_level1 -0.25
#property indicator_level2 0.25

extern int period=10;
extern int bars_count=1000;

double         ExtBuffer0[];
double         ExtBuffer1[];
double         ExtBuffer2[];


int init()
  {


   SetIndexStyle(0,DRAW_NONE);
   SetIndexStyle(1,DRAW_HISTOGRAM);
   SetIndexStyle(2,DRAW_HISTOGRAM);
   //IndicatorDigits(Digits+1);

   SetIndexBuffer(0,ExtBuffer0);
   SetIndexBuffer(1,ExtBuffer1);
   SetIndexBuffer(2,ExtBuffer2);

   IndicatorShortName("Fisher");
   SetIndexLabel(1,NULL);
   SetIndexLabel(2,NULL);

   return(0);
  }


int start()
  {
   //int     period=10;
   int    limit;
   int    counted_bars=IndicatorCounted();
   double prev,current,old;
   double Value=0,Value1=0,Value2=0,Fish=0,Fish1=0,Fish2=0;
   double price;
   double MinL=0;
   double MaxH=0;


   if(counted_bars>0) counted_bars--;
   if(bars_count > Bars || bars_count==0)
   {
      limit=Bars - period;
   }else{
      limit=bars_count-period;
   }


   for(int i=limit; i>=0; i--)
    {  MaxH = High[Highest(NULL,0,MODE_HIGH,period,i)];
       MinL = Low[Lowest(NULL,0,MODE_LOW,period,i)];
      price = (High[i]+Low[i])/2;
      Value = 0.33*2*((price-MinL)/(MaxH-MinL)-0.5) + 0.67*Value1;
      Value=MathMin(MathMax(Value,-0.999),0.999);
      ExtBuffer0[i]=0.5*MathLog((1+Value)/(1-Value))+0.5*Fish1;
      Value1=Value;
      Fish1=ExtBuffer0[i];

    }


   bool up=true;
   for(i=limit-2; i>=0; i--)
     {
      current=ExtBuffer0[i];
      prev=ExtBuffer0[i+1];

      if (((current<0)&&(prev>0))||(current<0))   up= false;
      if (((current>0)&&(prev<0))||(current>0))   up= true;

      if(!up)
        {
         ExtBuffer2[i]=current;
         ExtBuffer1[i]=0.0;
        }

       else
         {
          ExtBuffer1[i]=current;
          ExtBuffer2[i]=0.0;
         }
     }

   return(0);
  }
Comments