Fisher_Yur4ik_Alert_v2
Download script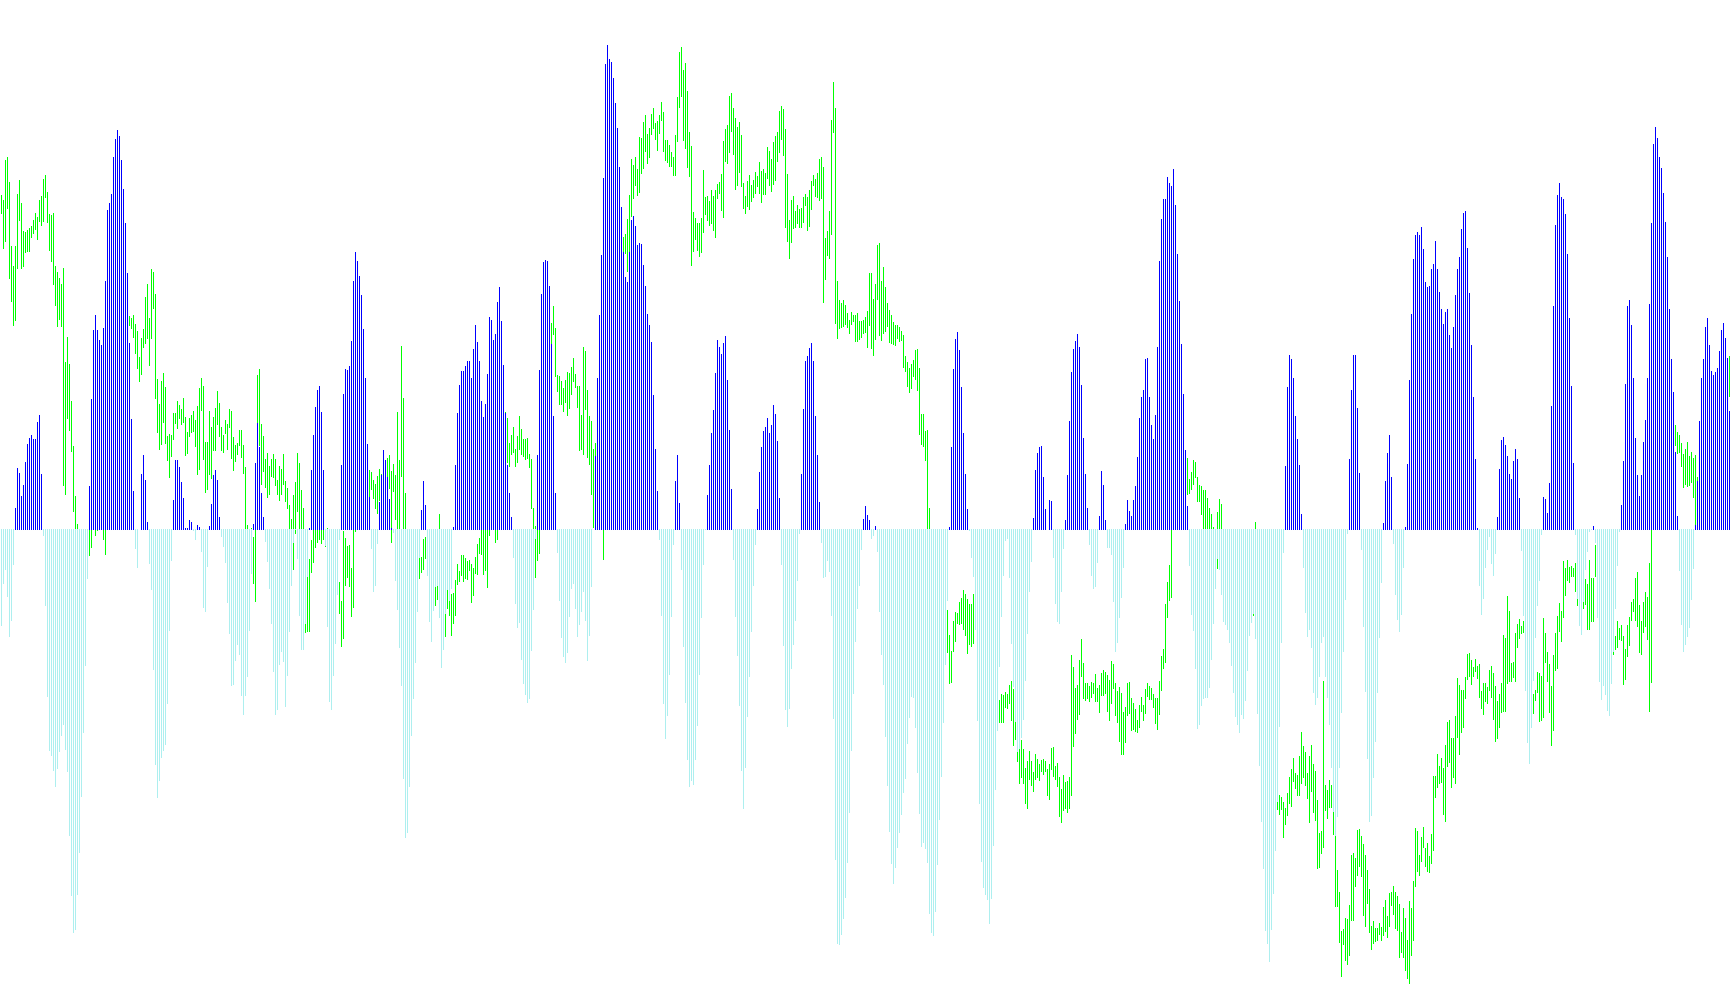
This script is a specialized technical analysis tool designed to help traders identify momentum shifts and trend reversals by processing price action into a visual histogram. It functions as a sophisticated oscillator that smooths out market "noise" to highlight the underlying strength of a movement.
How the Logic Works
1. Price Range Analysis The tool begins by looking at a specific window of time (determined by the user-defined period). Within this window, it identifies the highest price reached and the lowest price reached. By calculating the midpoint of the current price relative to these extremes, the script determines where the market is currently positioned—essentially asking if the price is leaning toward the top, the bottom, or sitting in the middle of its recent range.
2. Momentum Calculation Instead of reacting instantly to every small price flick, the script uses a weighted calculation. It blends the current price position with the results of previous calculations. This creates a "smoothed" momentum value. This value is then mathematically transformed into a logarithmic scale, which helps in visualizing significant surges or drops more clearly than raw price data would allow.
3. Trend Detection and Visualization The most important part of the script’s logic is how it interprets the resulting data:
- Positive Momentum: When the calculated value is above zero, the tool considers the momentum to be "upward."
- Negative Momentum: When the value drops below zero, it signals "downward" momentum.
4. Visual Representation To make this easy for a user to read at a glance, the script translates these mathematical results into a dual-colored histogram:
- The tool tracks whether the trend is currently rising or falling based on whether the value is positive or negative.
- It then applies different colors (Lime and Red) to the histogram bars to represent these states.
- When the momentum crosses from positive to negative (or vice versa), the color changes, providing a clear visual cue that the trend direction has shifted.
In summary, this tool takes raw price extremes, calculates a smoothed momentum score, and translates that score into a color-coded visual guide to help traders identify when a market trend is gaining strength or beginning to reverse.
#property  copyright "Copyright © 2005, Yura Prokofiev"
#property  link      "Yura.prokofiev@gmail.com"

#property  indicator_separate_window
#property  indicator_buffers 3
#property  indicator_color1  Black
#property  indicator_color2  Lime
#property  indicator_color3  Red

extern int period=10;
//extern string AlertFileName = "alert.wav";

double         ExtBuffer0[];
double         ExtBuffer1[];
double         ExtBuffer2[];


int init()
  {


   SetIndexStyle(0,DRAW_NONE);
   SetIndexStyle(1,DRAW_HISTOGRAM);
   SetIndexStyle(2,DRAW_HISTOGRAM);
   IndicatorDigits(Digits+1);

   SetIndexBuffer(0,ExtBuffer0);
   SetIndexBuffer(1,ExtBuffer1);
   SetIndexBuffer(2,ExtBuffer2);

   IndicatorShortName("Fisher_Yur4ik");
   SetIndexLabel(1,NULL);
   SetIndexLabel(2,NULL);

   return(0);
  }


int start()
  {
   //int     period=10;
   int    limit;
   int    counted_bars=IndicatorCounted();
   double prev,current,old;
   double Value=0,Value1=0,Value2=0,Fish=0,Fish1=0,Fish2=0;
   double price;
   double MinL=0;
   double MaxH=0;


   if(counted_bars>0) counted_bars--;
   limit=Bars-counted_bars;


   for(int i=0; i<limit; i++)
    {  MaxH = High[Highest(NULL,0,MODE_HIGH,period,i)];
       MinL = Low[Lowest(NULL,0,MODE_LOW,period,i)];
      price = (High[i]+Low[i])/2;
      Value = 0.33*2*((price-MinL)/(MaxH-MinL)-0.5) + 0.67*Value1;
      Value=MathMin(MathMax(Value,-0.999),0.999);
      ExtBuffer0[i]=0.5*MathLog((1+Value)/(1-Value))+0.5*Fish1;
      Value1=Value;
      Fish1=ExtBuffer0[i];

    }


   bool up=true;
   for(i=limit-2; i>=0; i--)
     {
      current=ExtBuffer0[i];
      prev=ExtBuffer0[i+1];

      if (((current<0)&&(prev>0))||(current<0))   up= false;
      if (((current>0)&&(prev<0))||(current>0))   up= true;

      if ((current<0)&&(prev>0))
         {
         //PlaySound(AlertFileName);
         }
      if ((current>0)&&(prev<0))
         {
         //PlaySound(AlertFileName);
         }

      if(!up)
        {
         ExtBuffer2[i]=current;
         ExtBuffer1[i]=0.0;
        }

       else
         {
          ExtBuffer1[i]=current;
          ExtBuffer2[i]=0.0;
         }
     }

   return(0);
  }
Comments