Fisher_Yur4ik_2
Download script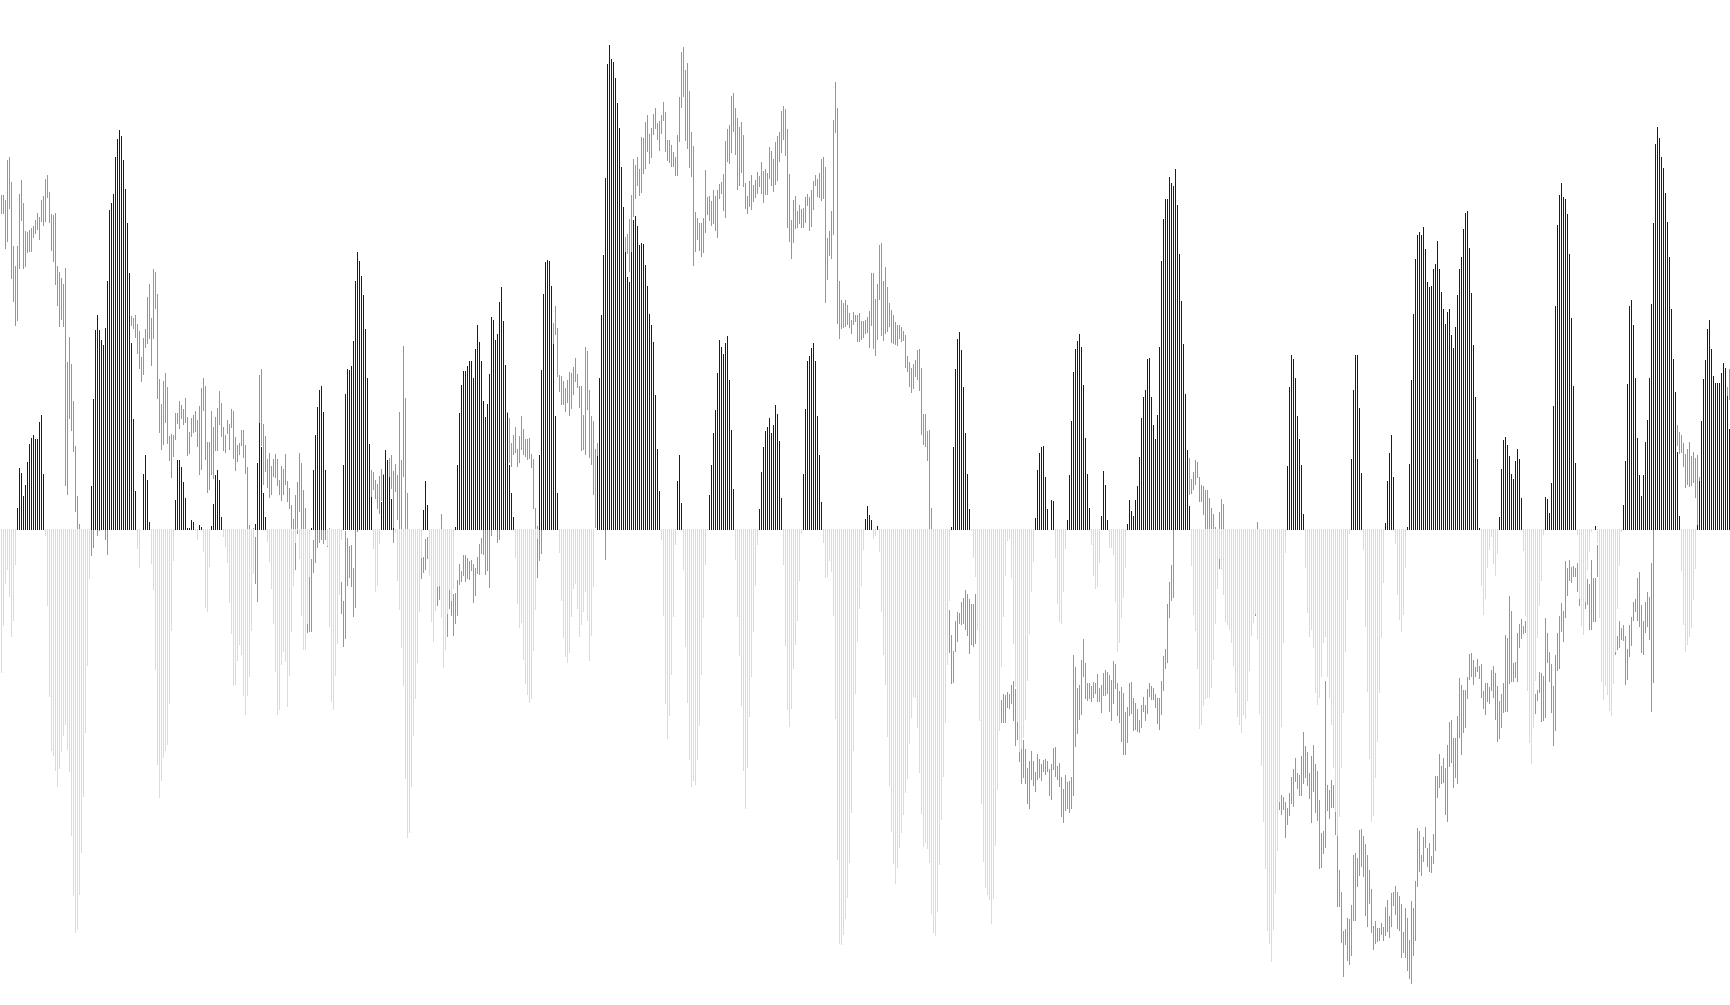
This tool is designed as a visual momentum indicator that helps traders identify the strength and direction of price movement by smoothing out market "noise." It functions by analyzing the relationship between the current price and the recent high and low points within a specific timeframe.
Core Logic and Methodology
The script operates through three primary logical stages:
1. Price Position Analysis The indicator first looks at a set window of past bars (defined by the user) to determine the highest peak and the lowest valley. It then calculates where the current price sits relative to that range. By determining if the price is closer to the top, bottom, or middle of this range, the tool establishes a baseline for whether the current momentum is leaning bullish or bearish.
2. Smoothing and Weighting To prevent the indicator from reacting too wildly to every minor price tick, the script uses a weighted smoothing technique. It takes the current price position and blends it with the previous values. This creates a continuous flow that reflects the underlying trend rather than just immediate volatility. The results are then mathematically scaled to ensure the data remains within a manageable range for visual analysis.
3. Momentum Transformation The script applies a logarithmic calculation to the smoothed data. This is a sophisticated way of highlighting "explosive" moves in price. In plain terms, it stretches the visual representation of the trend so that significant momentum shifts are more apparent to the human eye, making it easier to see when a trend is accelerating or decelerating.
Visual Representation
The tool provides a clear, binary visual output on a separate window:
- Trend Identification: The script automatically detects "crossovers" (where the momentum flips from positive to negative or vice versa).
- Color Coding: It utilizes two distinct colors—Lime and Red—to represent the current state of the market.
- Dynamic Mapping: When the momentum is positive, the indicator highlights the movement in one color; when it turns negative, it switches to the other. This allows a trader to see at a glance whether the current price action supports an upward or downward move without having to interpret complex raw numbers.
#property  copyright "Copyright © 2005, Yura Prokofiev"
#property  link      "Yura.prokofiev@gmail.com"

#property  indicator_separate_window
#property  indicator_buffers 3
#property  indicator_color2  Lime
#property  indicator_color3  Red
#property indicator_style2 STYLE_SOLID
#property indicator_style3 STYLE_SOLID
#property indicator_width2 2
#property indicator_width3 2
extern int period=10;

double         ExtBuffer0[];
double         ExtBuffer1[];
double         ExtBuffer2[];


int init()
  {

   SetIndexStyle(0,DRAW_NONE);
   SetIndexStyle(1,DRAW_HISTOGRAM);
   SetIndexStyle(2,DRAW_HISTOGRAM);
   IndicatorDigits(Digits+1);

   SetIndexBuffer(0,ExtBuffer0);
   SetIndexBuffer(1,ExtBuffer1);
   SetIndexBuffer(2,ExtBuffer2);

   IndicatorShortName("Fisher_Yur4ik");
   SetIndexLabel(1,NULL);
   SetIndexLabel(2,NULL);

   return(0);
  }


int start()
  {
   //int     period=10;
   int    limit;
   int    counted_bars=IndicatorCounted();
   double prev,current,old;
   double Value=0,Value1=0,Value2=0,Fish=0,Fish1=0,Fish2=0;
   double price;
   double MinL=0;
   double MaxH=0;


   if(counted_bars>0) counted_bars--;
   limit=Bars-counted_bars;


   for(int i=0; i<Bars; i++)
    {
      MaxH = High[Highest(NULL,0,MODE_HIGH,period,i)];
      MinL = Low[Lowest(NULL,0,MODE_LOW,period,i)];
      price = (High[i]+Low[i])/2;

      if(MaxH-MinL == 0) Value = 0.33*2*(0-0.5) + 0.67*Value1;
      else Value = 0.33*2*((price-MinL)/(MaxH-MinL)-0.5) + 0.67*Value1;

      Value=MathMin(MathMax(Value,-0.999),0.999);

      if(1-Value == 0) ExtBuffer0[i]=0.5+0.5*Fish1;
      else ExtBuffer0[i]=0.5*MathLog((1+Value)/(1-Value))+0.5*Fish1;

      Value1=Value;
      Fish1=ExtBuffer0[i];
    }


   bool up=true;
   for(i=Bars; i>=0; i--)
     {
      current=ExtBuffer0[i];
      prev=ExtBuffer0[i+1];

      if (((current<0)&&(prev>0))||(current<0))   up= false;
      if (((current>0)&&(prev<0))||(current>0))   up= true;

      if(!up)
        {
         ExtBuffer2[i]=current;
         ExtBuffer1[i]=0.0;
        }

       else
         {
          ExtBuffer1[i]=current;
          ExtBuffer2[i]=0.0;
         }
     }

   return(0);
  }
Comments