FlatTrend V2_v1
Download script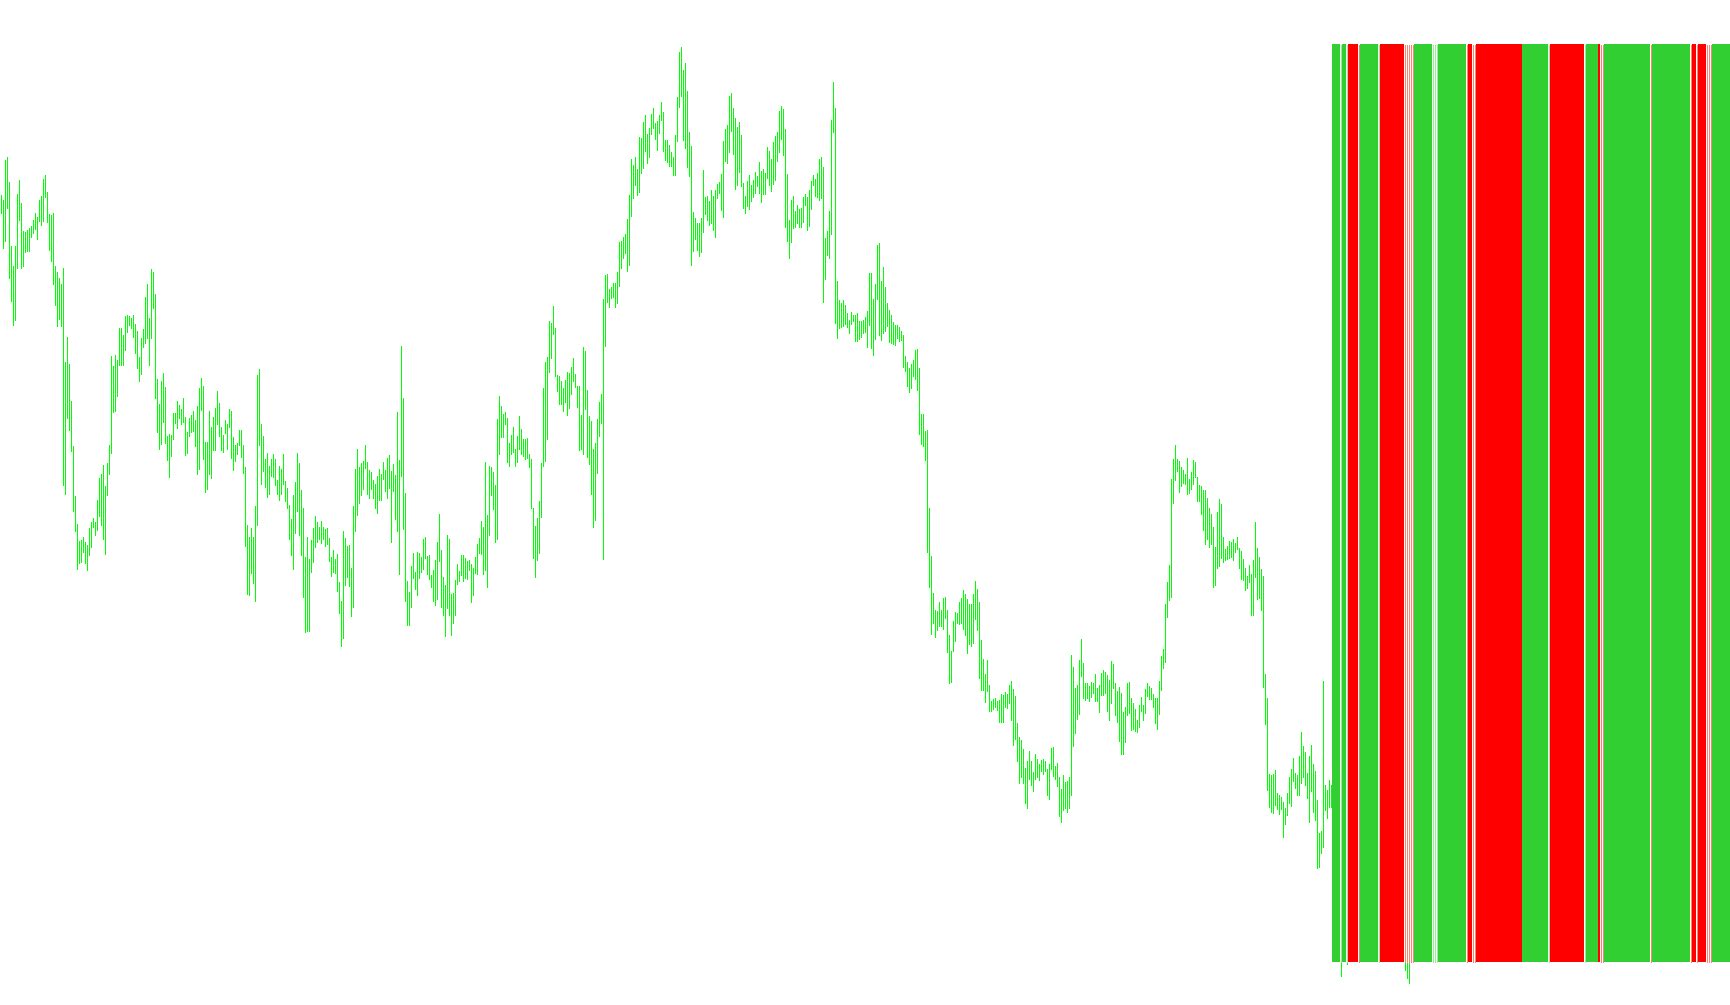
The Flat Trend indicator is designed to provide traders with a clear visual representation of market momentum and trend direction by synthesizing multiple technical analysis tools into a single, easy-to-read display. Rather than forcing you to look at several different charts, this script combines three distinct types of market logic to identify specific trading signals.
Core Components of the Logic
The indicator functions by evaluating three primary data points simultaneously:
- Trend Strength (ADX): It uses the Average Directional Index to determine the overall "power" of a trend. By comparing current movement against previous levels, it identifies whether the market is gaining momentum or losing steam.
- Price Positioning (Parabolic SAR): This component acts as a dynamic trailing stop. It helps the indicator understand where price has historically "flipped," allowing it to distinguish between a healthy trend and a potential reversal.
- Timeframe Flexibility: The logic is customizable, allowing you to view these signals across various intervals—ranging from quick 1-minute scalps to long-term daily or weekly trends.
How the Signals Work
The script processes these three components to generate different visual outputs (histograms) based on specific conditions:
- Bullish Momentum: When the price is positioned above the Parabolic SAR and the trend strength is increasing, the indicator identifies a strong upward move.
- Bearish Momentum: When the price falls below the Parabolic SAR and trend strength is increasing, it highlights a dominant downward move.
- Trend Shifts and Exhaustion: By comparing the relationship between the price location and the ADX strength, the indicator can differentiate between a steady move and a moment where the market might be "flat" or about to change direction.
User Experience
For the end user, this means the indicator acts as a filter. It simplifies complex market noise into a visual map. When the conditions for a specific trend are met, it lights up the corresponding histogram, allowing you to see at a glance whether the current price action is backed by sufficient strength and follows the prevailing trend structure.
//+------------------------------------------------------------------+
//|                                                    FlatTrend.mq4 |
//|                                                       Kirk Sloan |
//|                                        http://www.metaquotes.net |
//+------------------------------------------------------------------+
#property copyright "Kirk Sloan"
#property link      "http://www.metaquotes.net"

#property indicator_separate_window
#property indicator_minimum 0
#property indicator_maximum 1
#property indicator_buffers 4
#property indicator_color1 Red
#property indicator_color2 LimeGreen
#property indicator_color3 Gold
//---- input parameters
extern int       Minutes=5;
//---- buffers
double ExtMapBuffer1[];
double ExtMapBuffer2[];
double ExtMapBuffer3[];
double ExtMapBuffer4[];
double Ma;
double hhigh, llow;
double Psar;
double PADX,NADX;
string TimeFrameStr;
//+------------------------------------------------------------------+
//| Custom indicator initialization function                         |
//+------------------------------------------------------------------+
int init()
  {
//---- indicators
  SetIndexStyle(0,DRAW_HISTOGRAM,STYLE_SOLID,2,Red);
  SetIndexBuffer(0,ExtMapBuffer1);
  SetIndexStyle(1,DRAW_HISTOGRAM,STYLE_SOLID,2, LimeGreen);
  SetIndexBuffer(1,ExtMapBuffer2);
  SetIndexStyle(2,DRAW_HISTOGRAM,STYLE_SOLID,1, Salmon);
  SetIndexBuffer(2,ExtMapBuffer3);
   SetIndexStyle(3,DRAW_HISTOGRAM,STYLE_SOLID,1, LightGreen);
  SetIndexBuffer(3,ExtMapBuffer4);


switch(Minutes)
   {
      case 1 : TimeFrameStr="Period_M1"; break;
      case 5 : TimeFrameStr="Period_M5"; break;
      case 15 : TimeFrameStr="Period_M15"; break;
      case 30 : TimeFrameStr="Period_M30"; break;
      case 60 : TimeFrameStr="Period_H1"; break;
      case 240 : TimeFrameStr="Period_H4"; break;
      case 1440 : TimeFrameStr="Period_D1"; break;
      case 10080 : TimeFrameStr="Period_W1"; break;
      case 43200 : TimeFrameStr="Period_MN1"; break;
      default : TimeFrameStr="Current Timeframe"; Minutes=0;
   }
   IndicatorShortName("Flat Trend ("+TimeFrameStr+")");


//----
   return(0);
  }
//+------------------------------------------------------------------+
//| Custom indicator deinitialization function                       |
//+------------------------------------------------------------------+
int deinit()
  {
//----

//----
   return(0);
  }
//+------------------------------------------------------------------+
//| Custom indicator iteration function                              |
//+------------------------------------------------------------------+
int start()
  {
   int    counted_bars=IndicatorCounted();
//----

for (int i = 0; i < 200; i++){
   ExtMapBuffer1[i]=0;
   ExtMapBuffer2[i]=0;
   ExtMapBuffer3[i]=0;
   ExtMapBuffer4[i]=0;

   PADX=iADX(NULL,Minutes,14 ,PRICE_CLOSE,1,i);
   NADX=iADX(NULL,Minutes,14 ,PRICE_CLOSE,2,i);

   Psar = iSAR(NULL,Minutes,0.02,0.2,i) ;

   if (Psar < iClose(NULL, Minutes,i) && PADX > NADX){
      ExtMapBuffer2[i] = 1;
      }

   if (Psar < iClose(NULL, Minutes,i) && NADX > PADX){
      ExtMapBuffer4[i] = 1;
      }

   if (Psar > iClose(NULL, Minutes,i) && NADX > PADX){
      ExtMapBuffer1[i] = 1;
         }

   if (Psar > iClose(NULL, Minutes,i) && PADX > NADX){
      ExtMapBuffer3[i] = 1;
         }

   if (ExtMapBuffer1[i] == 0 && ExtMapBuffer2[i] == 0){
      //ExtMapBuffer3[i] = 1;
      }

}


//----
   return(0);
  }
//+------------------------------------------------------------------+
Comments