Fisher_Yur4ik_2_v1
Download script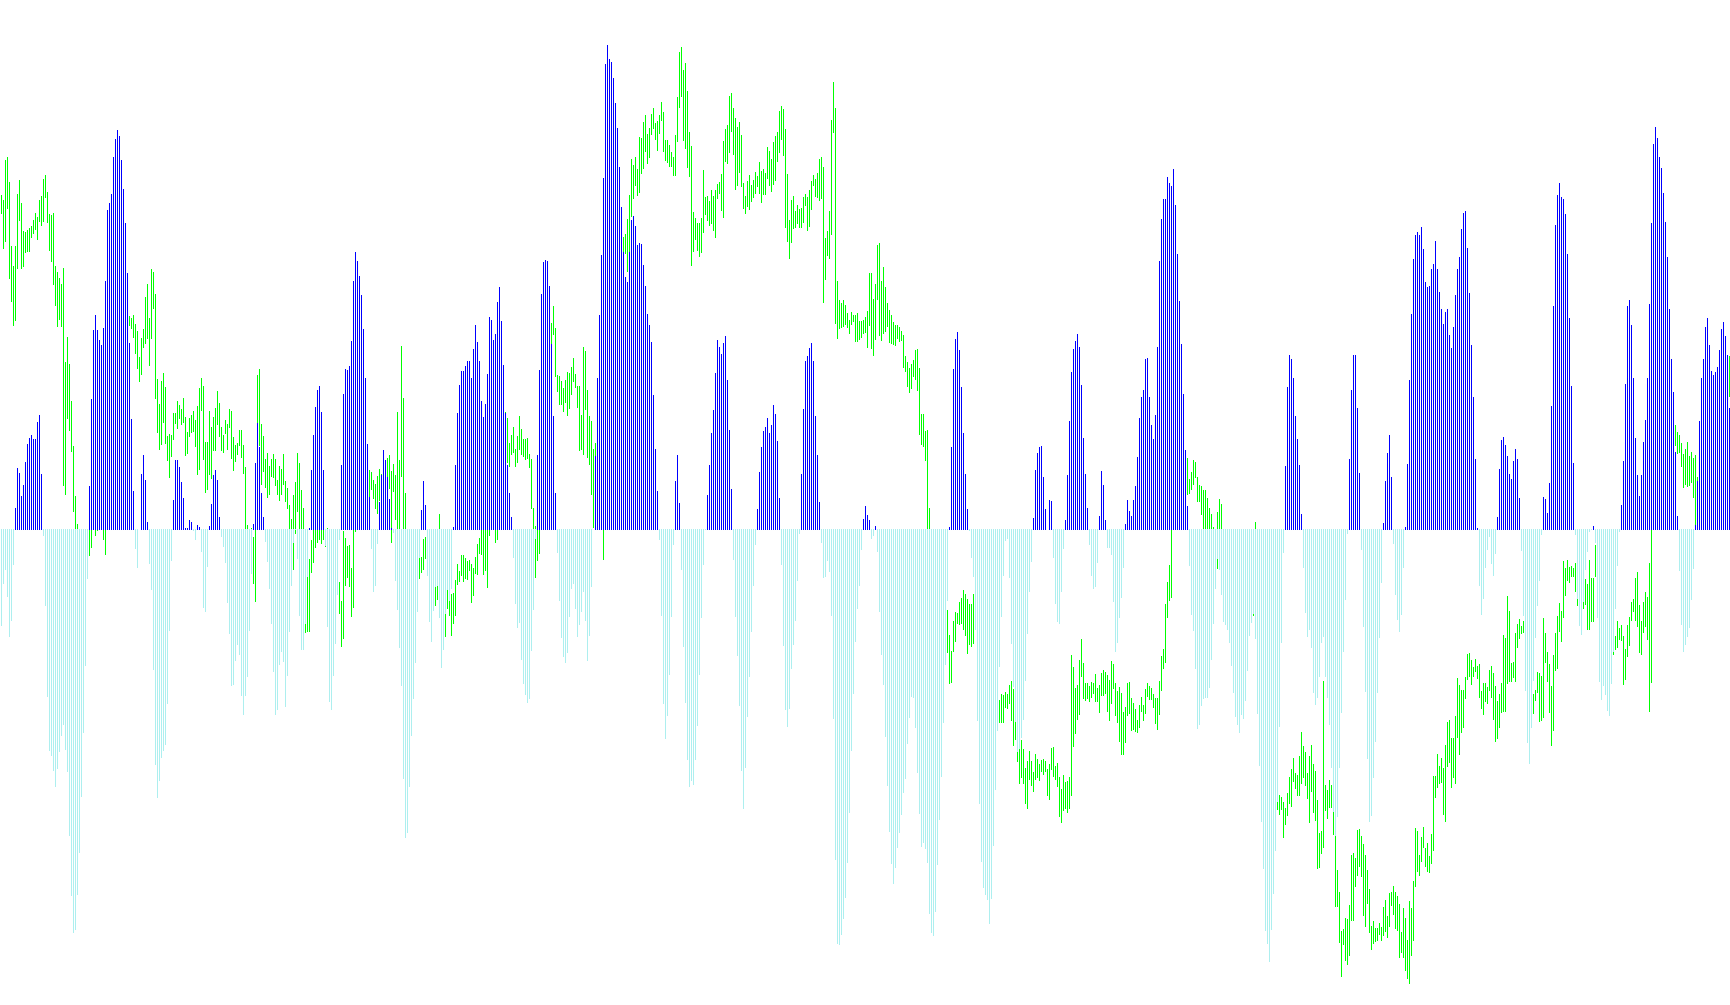
This tool is designed as a visual momentum indicator that helps traders identify market trends and potential reversal points by analyzing price action relative to recent highs and lows. Instead of simply looking at the raw price, it processes the data to determine where the current price sits within a specific time window, allowing for a smoother interpretation of market sentiment.
Core Logic and Mechanics
Price Positioning Analysis The script begins by identifying the highest peak and the lowest valley over a user-defined number of candles (the period). It then calculates the midpoint of the current candle's price range. By comparing this midpoint to the overall high and low of the period, the tool determines whether the market is leaning toward the top, the bottom, or remains neutral.
Trend Smoothing To prevent the data from being too erratic or "noisy," the script applies a weighted smoothing technique. It takes a portion of the current price position and blends it with the previous calculation. This ensures that the resulting movement flows smoothly across the chart, helping to filter out minor market fluctuations while preserving the overall direction of the trend.
Momentum Conversion Once the smoothed value is established, the script performs a mathematical transformation (logarithmic scaling) to convert these movements into a momentum oscillator. This creates a distinct "wave" effect that reflects the velocity of price changes. The values are constrained within a specific range to keep the visual display clean and consistent.
Visual Representation
The indicator provides clear, color-coded visual cues to help with decision-making:
- Trend Tracking: The script monitors whether the momentum wave is moving above or below a zero baseline.
- Dynamic Coloring: It uses two distinct colors—Lime and Red—to signify different market conditions.
- One color highlights periods of upward momentum (bullish sentiment).
- The other color highlights periods of downward momentum (bearish sentiment).
- Signal Clarity: By highlighting only the active trend, the tool allows traders to see exactly when a shift in momentum occurs. When the "wave" crosses the zero line and changes direction, the indicator updates its color, providing a visual signal that the previous trend may be weakening or reversing.
Summary for the User
Essentially, this script takes complex price fluctuations and boils them down into a clear, moving wave. It tells you how strongly the price is pushing in one direction compared to recent history. When the color flips, it serves as a visual cue that the market's "weight" has shifted from one side to the other, helping you identify whether the current environment is leaning toward growth or decline.
/*-----------------------------+
|			       |
| Shared by www.Aptrafx.com    |
|			       |
+------------------------------*/

#property  copyright "Copyright © 2005, Yura Prokofiev"
#property  link      "Yura.prokofiev@gmail.com"

#property  indicator_separate_window
#property  indicator_buffers 3
#property  indicator_color2  Lime
#property  indicator_color3  Red
#property indicator_style2 STYLE_SOLID
#property indicator_style3 STYLE_SOLID
#property indicator_width2 2
#property indicator_width3 2
extern int period=10;

double         ExtBuffer0[];
double         ExtBuffer1[];
double         ExtBuffer2[];


int init()
  {

   SetIndexStyle(0,DRAW_NONE);
   SetIndexStyle(1,DRAW_HISTOGRAM);
   SetIndexStyle(2,DRAW_HISTOGRAM);
   IndicatorDigits(Digits+1);

   SetIndexBuffer(0,ExtBuffer0);
   SetIndexBuffer(1,ExtBuffer1);
   SetIndexBuffer(2,ExtBuffer2);

   IndicatorShortName("Fisher_Yur4ik");
   SetIndexLabel(1,NULL);
   SetIndexLabel(2,NULL);

   return(0);
  }


int start()
  {
   //int     period=10;
   int    limit;
   int    counted_bars=IndicatorCounted();
   double prev,current,old;
   double Value=0,Value1=0,Value2=0,Fish=0,Fish1=0,Fish2=0;
   double price;
   double MinL=0;
   double MaxH=0;


   if(counted_bars>0) counted_bars--;
   limit=Bars-counted_bars;


   for(int i=0; i<Bars; i++)
    {
      MaxH = High[Highest(NULL,0,MODE_HIGH,period,i)];
      MinL = Low[Lowest(NULL,0,MODE_LOW,period,i)];
      price = (High[i]+Low[i])/2;

      if(MaxH-MinL == 0) Value = 0.33*2*(0-0.5) + 0.67*Value1;
      else Value = 0.33*2*((price-MinL)/(MaxH-MinL)-0.5) + 0.67*Value1;

      Value=MathMin(MathMax(Value,-0.999),0.999);

      if(1-Value == 0) ExtBuffer0[i]=0.5+0.5*Fish1;
      else ExtBuffer0[i]=0.5*MathLog((1+Value)/(1-Value))+0.5*Fish1;

      Value1=Value;
      Fish1=ExtBuffer0[i];
    }


   bool up=true;
   for(i=Bars; i>=0; i--)
     {
      current=ExtBuffer0[i];
      prev=ExtBuffer0[i+1];

      if (((current<0)&&(prev>0))||(current<0))   up= false;
      if (((current>0)&&(prev<0))||(current>0))   up= true;

      if(!up)
        {
         ExtBuffer2[i]=current;
         ExtBuffer1[i]=0.0;
        }

       else
         {
          ExtBuffer1[i]=current;
          ExtBuffer2[i]=0.0;
         }
     }

   return(0);
  }
Comments