FlatTrend1
Download script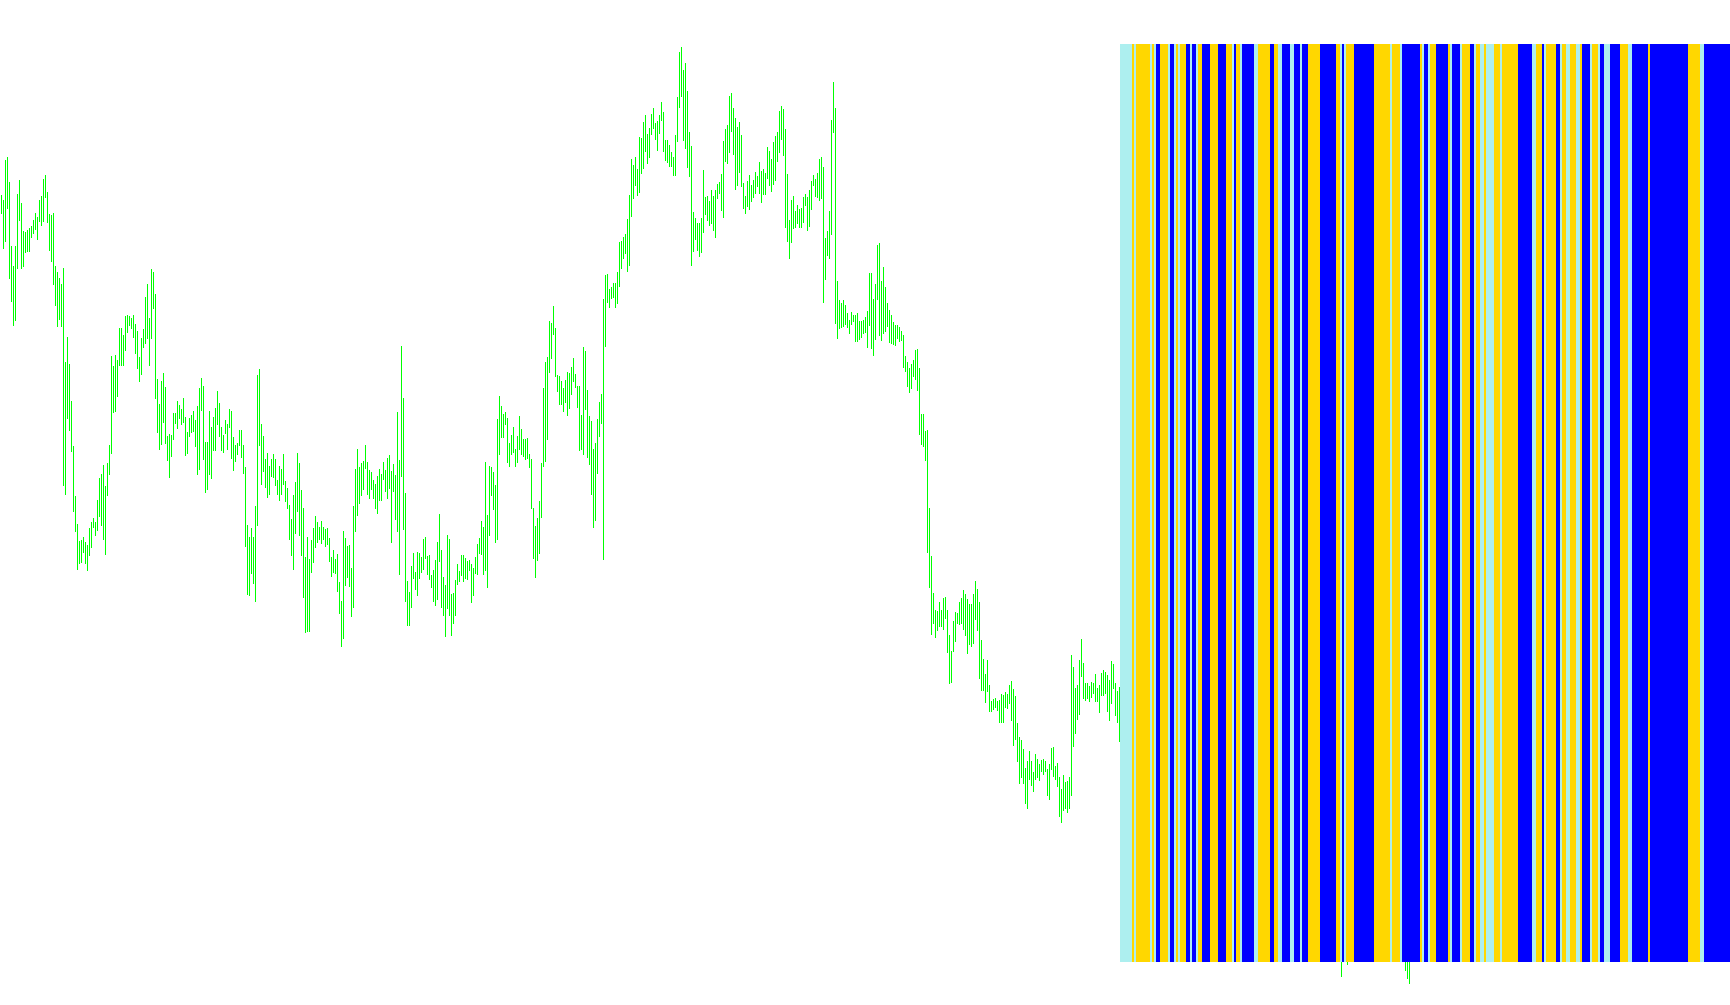
The FlatTrend indicator is designed to provide traders with a clear visual representation of market momentum and trend direction. Rather than cluttering the main price chart, it operates in a separate window, using color-coded histograms to signal specific market conditions based on three distinct layers of logic.
Core Logic Components
The script analyzes the market by combining three different technical tools:
- Trend Strength (ADX): It measures the overall "force" or strength of the current trend.
- Trend Direction (Parabolic SAR): It identifies whether the price is moving upward or downward relative to a specific acceleration point.
- Momentum Comparison: It looks at the immediate change in strength between the current bar and previous bars to confirm that movement is gaining speed.
How the Visuals Work
The indicator uses three different colors (Red, Green, and Dark Orange) to communicate the market state:
- Green Signals (Bullish Momentum): The indicator highlights a potential upward trend when the price is positioned above the Parabolic SAR, the trend strength is high enough (at or above a specific threshold), and the momentum is actively increasing.
- Red Signals (Bearish Momentum): Conversely, it highlights a potential downward trend when the price falls below the Parabolic SAR, the trend strength meets the minimum requirement, and the downward momentum is accelerating.
- Dark Orange Signals (Neutral/Flat Market): This serves as a "baseline" indicator. When neither the bullish nor the bearish conditions are met, the indicator displays this color. It essentially tells the trader that there is currently no significant trend to trade, signaling a period of consolidation or "flat" price action.
Customization and Timeframes
The script is built to be flexible for different trading styles. Users can adjust the sensitivity of the strength filters and the acceleration of the trend detection. Additionally, it allows for multi-timeframe analysis, meaning you can set the indicator to track trends on specific intervals—ranging from 1-minute "scalping" charts up to monthly views—ensuring the logic remains consistent regardless of the timeframe selected.
//+------------------------------------------------------------------+
//|                                                    FlatTrend.mq4 |
//|                                                       Kirk Sloan |
//|                               modified by Ronald Verwer/ROVERCOM |
//+------------------------------------------------------------------+
#property copyright "Kirk Sloan/Ronald Verwer"

#property indicator_separate_window
#property indicator_minimum 0
#property indicator_maximum 1
#property indicator_buffers 3
#property indicator_color1 Red
#property indicator_color2 Green
#property indicator_color3 DarkOrange
#property indicator_width1 2
#property indicator_width2 2
#property indicator_width3 2
//---- input parameters
extern int Minutes=5;
extern int ADX=4;
extern double PSarStep=0.09;
extern double PSarMax=0.5;
//---- buffers
double ExtMapBuffer1[];
double ExtMapBuffer2[];
double ExtMapBuffer3[];
double Ma;
double hhigh, llow;
double Psar;
double AADX,PADX,NADX;
string TimeFrameStr;
//+------------------------------------------------------------------+
//| Custom indicator initialization function                         |
//+------------------------------------------------------------------+
int init()
   {
//---- indicators
   SetIndexStyle(0,DRAW_HISTOGRAM,STYLE_SOLID,2);
   SetIndexBuffer(0,ExtMapBuffer1);
   SetIndexStyle(1,DRAW_HISTOGRAM,STYLE_SOLID,2);
   SetIndexBuffer(1,ExtMapBuffer2);
   SetIndexStyle(2,DRAW_HISTOGRAM,STYLE_SOLID,2);
   SetIndexBuffer(2,ExtMapBuffer3);
   SetIndexLabel(0,NULL);
   SetIndexLabel(1,NULL);
   SetIndexLabel(2,NULL);

   switch(Minutes)
    {
       case 1 : TimeFrameStr="1M"; break;
       case 5 : TimeFrameStr="5M"; break;
       case 15 : TimeFrameStr="15M"; break;
       case 30 : TimeFrameStr="30M"; break;
       case 60 : TimeFrameStr="1H"; break;
       case 240 : TimeFrameStr="4H"; break;
       case 1440 : TimeFrameStr="D"; break;
       case 10080 : TimeFrameStr="W"; break;
       case 43200 : TimeFrameStr="MN"; break;
       default : TimeFrameStr="Current Timeframe"; Minutes=0;
    }
    IndicatorShortName(""+TimeFrameStr+" Trend");
//----
    return(0);
   }
 //+------------------------------------------------------------------+
//| Custom indicator deinitialization function                       |
//+------------------------------------------------------------------+
int deinit()
   {
//----

//----
    return(0);
   }
//+------------------------------------------------------------------+
//| Custom indicator iteration function                              |
//+------------------------------------------------------------------+
int start()
   {
    int    counted_bars=IndicatorCounted();
//----
for (int i = 0; i < 300; i++){
    ExtMapBuffer1[i]=0;
    ExtMapBuffer2[i]=0;
    ExtMapBuffer3[i]=0;

    AADX=iADX(NULL,Minutes,ADX,PRICE_CLOSE,0,i);
    PADX=iADX(NULL,Minutes,ADX,PRICE_CLOSE,1,i);
    NADX=iADX(NULL,Minutes,ADX,PRICE_CLOSE,2,i);

    Psar = iSAR(NULL,Minutes,PSarStep,PSarMax,i) ;

    if (Psar < iClose(NULL, Minutes,i) && PADX > NADX && AADX >= 20){
       ExtMapBuffer2[i] = 1;
       }
    if (Psar > iClose(NULL, Minutes,i) && NADX > PADX && AADX >= 20){
       ExtMapBuffer1[i] = 1;
       }
    if (ExtMapBuffer1[i] == 0 && ExtMapBuffer2[i] == 0){
       ExtMapBuffer3[i] = 1;
       }
   }
//----
   return(0);
   }
//+------------------------------------------------------------------+
Comments