Fisher_Yur4ik
Download script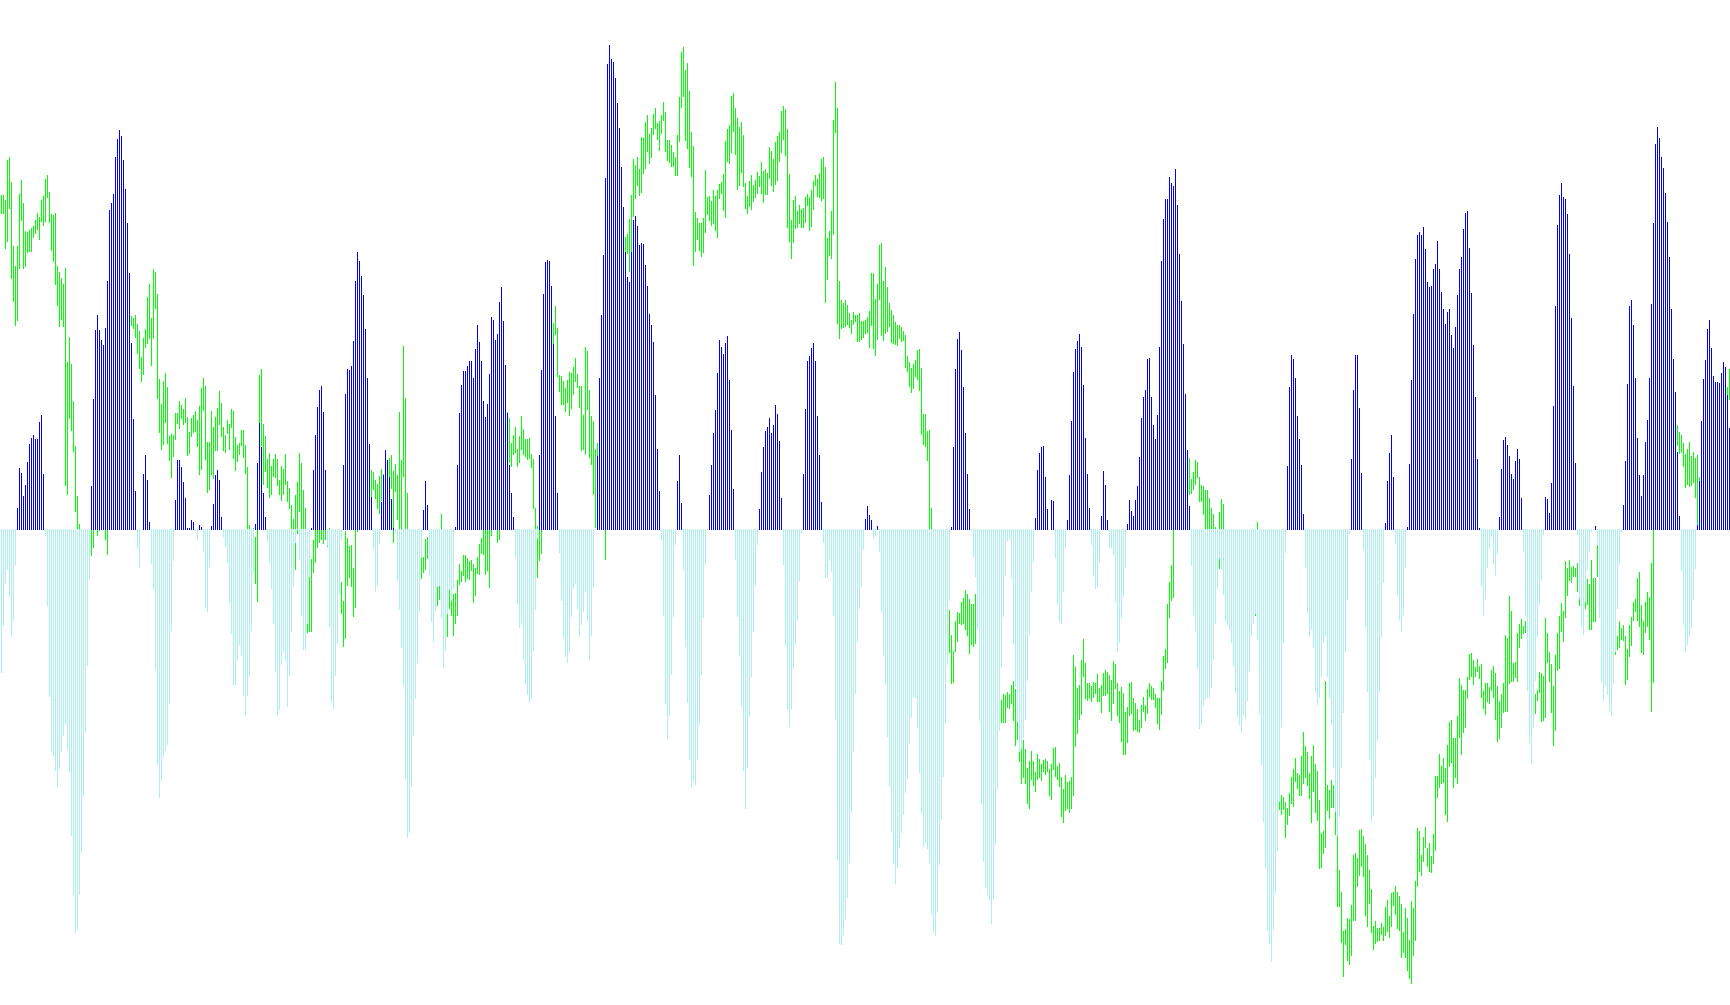
This tool is designed as a visual momentum indicator for financial charts, specifically tailored to identify price trends and potential shifts in market direction. By analyzing historical price action over a user-defined timeframe, it translates complex market movements into a simplified color-coded histogram that helps traders distinguish between upward and downward pressure.
Core Methodology
The underlying logic operates by identifying the highest highs and lowest lows within a specific rolling window (the "period"). From these extremes, the tool calculates the midpoint of the current price. It then processes this data through a mathematical formula that compares where the current price sits relative to those extremes.
This calculation is smoothed over time, ensuring that the resulting data doesn't react erratically to minor price flickers but instead reflects the broader flow of the market. To ensure the data remains readable and focused on significant trends, the logic applies a "ceiling" and "floor," preventing the values from expanding infinitely in either direction.
Visual Representation
The script translates these mathematical results into two distinct visual components:
- Trend Identification: The indicator produces a continuous line of values that represent the strength of the current price movement.
- Dynamic Color Coding: The logic automatically detects "crossovers"—moments where the momentum shifts from positive to negative or vice versa.
- When the market shows upward momentum, the indicator highlights the data in one color (Lime).
- When the market shifts to downward momentum, it switches to another color (Red).
User Experience
For a trader, this means the tool acts as a visual filter. Instead of manually interpreting raw price candles, the visitor can look at the histogram to see the "mood" of the market. The primary goal is to provide a clear distinction between bullish and bearish phases, allowing for quicker identification of trend changes in real-time.
#property  copyright "Copyright © 2005, Yura Prokofiev"
#property  link      "Yura.prokofiev@gmail.com"

#property  indicator_separate_window
#property  indicator_buffers 3
#property  indicator_color1  Black
#property  indicator_color2  Lime
#property  indicator_color3  Red

extern int period=10;

double         ExtBuffer0[];
double         ExtBuffer1[];
double         ExtBuffer2[];


int init()
  {


   SetIndexStyle(0,DRAW_NONE);
   SetIndexStyle(1,DRAW_HISTOGRAM);
   SetIndexStyle(2,DRAW_HISTOGRAM);
   IndicatorDigits(Digits+1);

   SetIndexBuffer(0,ExtBuffer0);
   SetIndexBuffer(1,ExtBuffer1);
   SetIndexBuffer(2,ExtBuffer2);

   IndicatorShortName("Fisher_Yur4ik");
   SetIndexLabel(1,NULL);
   SetIndexLabel(2,NULL);

   return(0);
  }


int start()
  {
   //int     period=10;
   int    limit;
   int    counted_bars=IndicatorCounted();
   double prev,current,old;
   double Value=0,Value1=0,Value2=0,Fish=0,Fish1=0,Fish2=0;
   double price;
   double MinL=0;
   double MaxH=0;


   if(counted_bars>0) counted_bars--;
   limit=Bars-counted_bars;


   for(int i=0; i<limit; i++)
    {  MaxH = High[Highest(NULL,0,MODE_HIGH,period,i)];
       MinL = Low[Lowest(NULL,0,MODE_LOW,period,i)];
      price = (High[i]+Low[i])/2;
      Value = 0.33*2*((price-MinL)/(MaxH-MinL)-0.5) + 0.67*Value1;
      Value=MathMin(MathMax(Value,-0.999),0.999);
      ExtBuffer0[i]=0.5*MathLog((1+Value)/(1-Value))+0.5*Fish1;
      Value1=Value;
      Fish1=ExtBuffer0[i];

    }


   bool up=true;
   for(i=limit-2; i>=0; i--)
     {
      current=ExtBuffer0[i];
      prev=ExtBuffer0[i+1];

      if (((current<0)&&(prev>0))||(current<0))   up= false;
      if (((current>0)&&(prev<0))||(current>0))   up= true;

      if(!up)
        {
         ExtBuffer2[i]=current;
         ExtBuffer1[i]=0.0;
        }

       else
         {
          ExtBuffer1[i]=current;
          ExtBuffer2[i]=0.0;
         }
     }

   return(0);
  }
Comments