Fisher_Yur4ik_v2
Download script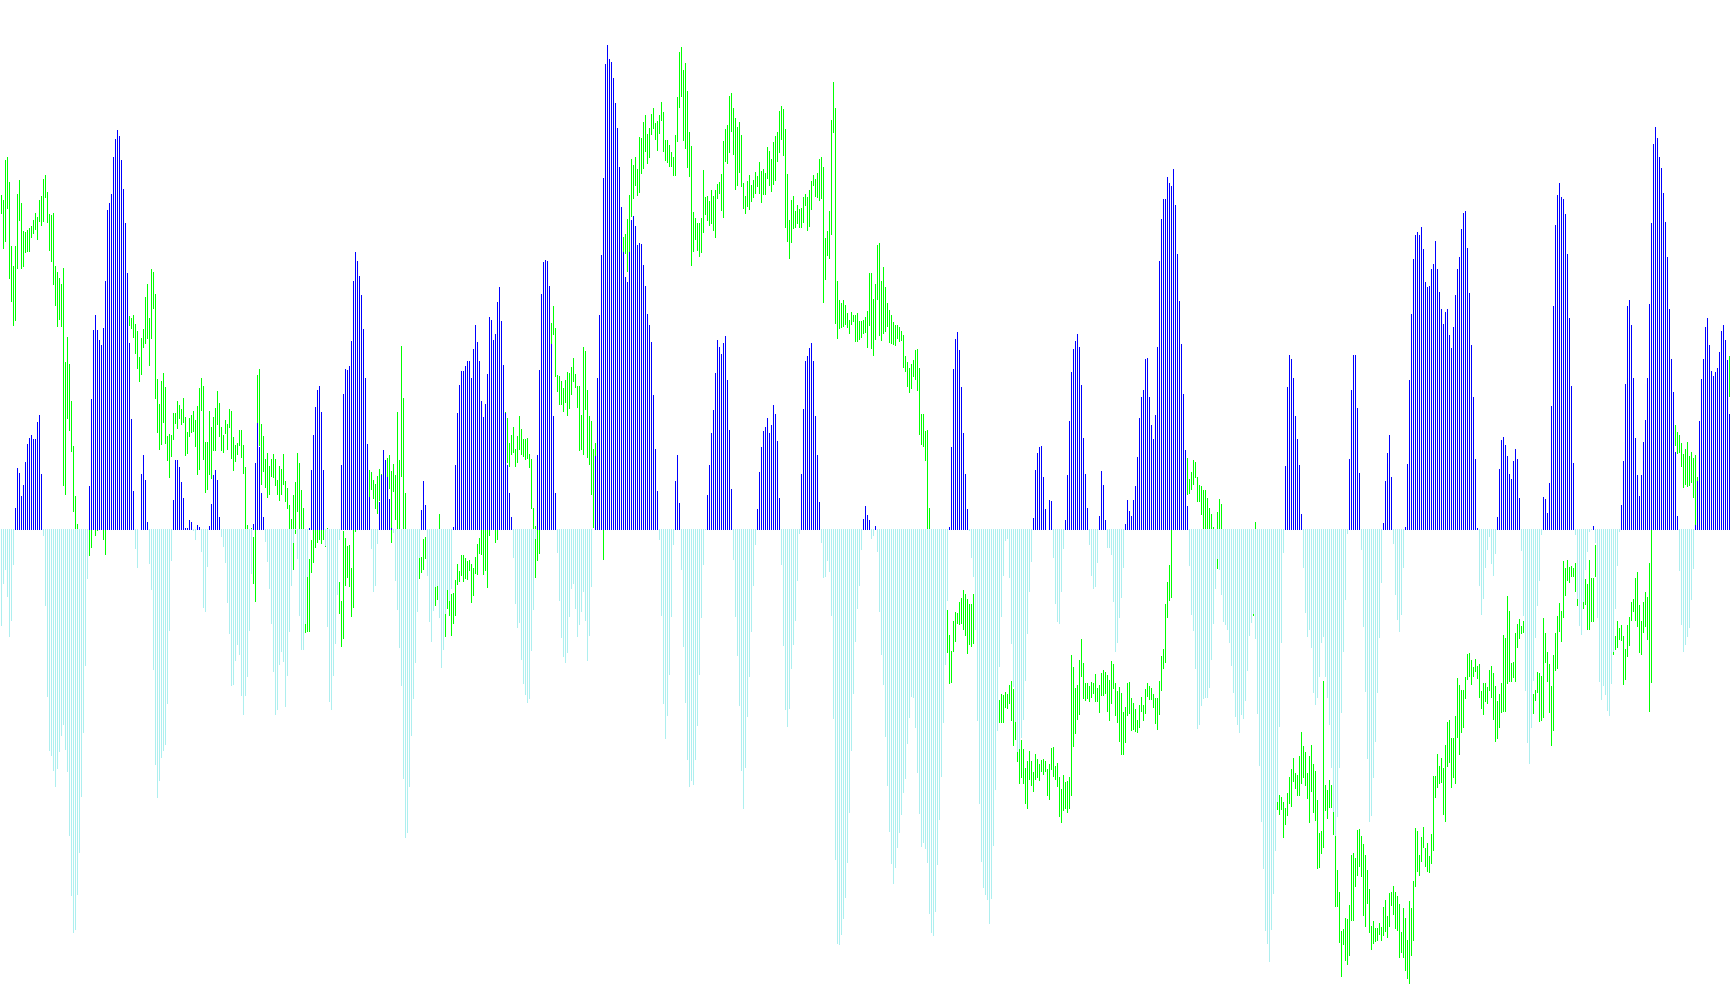
This tool is designed to help traders visualize market momentum by identifying the direction and strength of price movements. It functions as a dynamic oscillator that interprets the relationship between current market highs and lows over a specific timeframe (adjustable by the user).
Core Mechanism
The underlying logic works by scanning a fixed window of recent price bars to determine the highest high and lowest low reached during that period. By calculating where the current price sits relative to these boundaries, the script determines if the market is pushing toward its upper limits or sinking toward its lower limits.
This raw data is then processed through a smoothing calculation. This prevents the indicator from reacting erratically to minor "noise" in the market, ensuring that the resulting movement reflects a more consistent trend rather than momentary spikes. The final output is transformed into a logarithmic scale, which helps in visualizing the acceleration or deceleration of price momentum more clearly.
Visual Representation and Interpretation
The script translates these complex calculations into a clear, visual histogram on a separate window beneath your main chart. Here is how to interpret the logic:
- Trend Identification: The indicator separates movement into two distinct colors (typically Lime and Red). This creates a clear "split" in the visual data, allowing you to see exactly when the momentum shifts from positive to negative.
- Momentum Tracking: When the histogram is active in one color, it signifies that the current price trend maintains positive momentum. When it switches to the other color, it indicates a shift into negative momentum.
- Dynamic Filtering: The logic includes a specific rule to ensure that colors only switch when a definitive change occurs. This helps the user distinguish between a temporary pause in price action and a genuine reversal of the prevailing trend.
In summary, this script acts as a momentum filter, distilling high-frequency price fluctuations into a smoothed visual guide that highlights the primary direction of market energy.
/*-----------------------------+
|			       |
| Shared by www.Aptrafx.com    |
|			       |
+------------------------------*/

#property  copyright "Copyright © 2005, Yura Prokofiev"
#property  link      "Yura.prokofiev@gmail.com"

#property  indicator_separate_window
#property  indicator_buffers 3
#property  indicator_color1  Black
#property  indicator_color2  Lime
#property  indicator_color3  Red

extern int period=10;

double         ExtBuffer0[];
double         ExtBuffer1[];
double         ExtBuffer2[];


int init()
  {


   SetIndexStyle(0,DRAW_NONE);
   SetIndexStyle(1,DRAW_HISTOGRAM);
   SetIndexStyle(2,DRAW_HISTOGRAM);
   IndicatorDigits(Digits+1);

   SetIndexBuffer(0,ExtBuffer0);
   SetIndexBuffer(1,ExtBuffer1);
   SetIndexBuffer(2,ExtBuffer2);

   IndicatorShortName("Fisher");
   SetIndexLabel(1,NULL);
   SetIndexLabel(2,NULL);

   return(0);
  }


int start()
  {
   //int     period=10;
   int    limit;
   int    counted_bars=IndicatorCounted();
   double prev,current,old;
   double Value=0,Value1=0,Value2=0,Fish=0,Fish1=0,Fish2=0;
   double price;
   double MinL=0;
   double MaxH=0;


   if(counted_bars>0) counted_bars--;
   limit=Bars-counted_bars;


   for(int i=0; i<limit; i++)
    {  MaxH = High[Highest(NULL,0,MODE_HIGH,period,i)];
       MinL = Low[Lowest(NULL,0,MODE_LOW,period,i)];
      price = (High[i]+Low[i])/2;
      Value = 0.33*2*((price-MinL)/(MaxH-MinL)-0.5) + 0.67*Value1;
      Value=MathMin(MathMax(Value,-0.999),0.999);
      ExtBuffer0[i]=0.5*MathLog((1+Value)/(1-Value))+0.5*Fish1;
      Value1=Value;
      Fish1=ExtBuffer0[i];

    }


   bool up=true;
   for(i=limit-2; i>=0; i--)
     {
      current=ExtBuffer0[i];
      prev=ExtBuffer0[i+1];

      if (((current<0)&&(prev>0))||(current<0))   up= false;
      if (((current>0)&&(prev<0))||(current>0))   up= true;

      if(!up)
        {
         ExtBuffer2[i]=current;
         ExtBuffer1[i]=0.0;
        }

       else
         {
          ExtBuffer1[i]=current;
          ExtBuffer2[i]=0.0;
         }
     }

   return(0);
  }
Comments