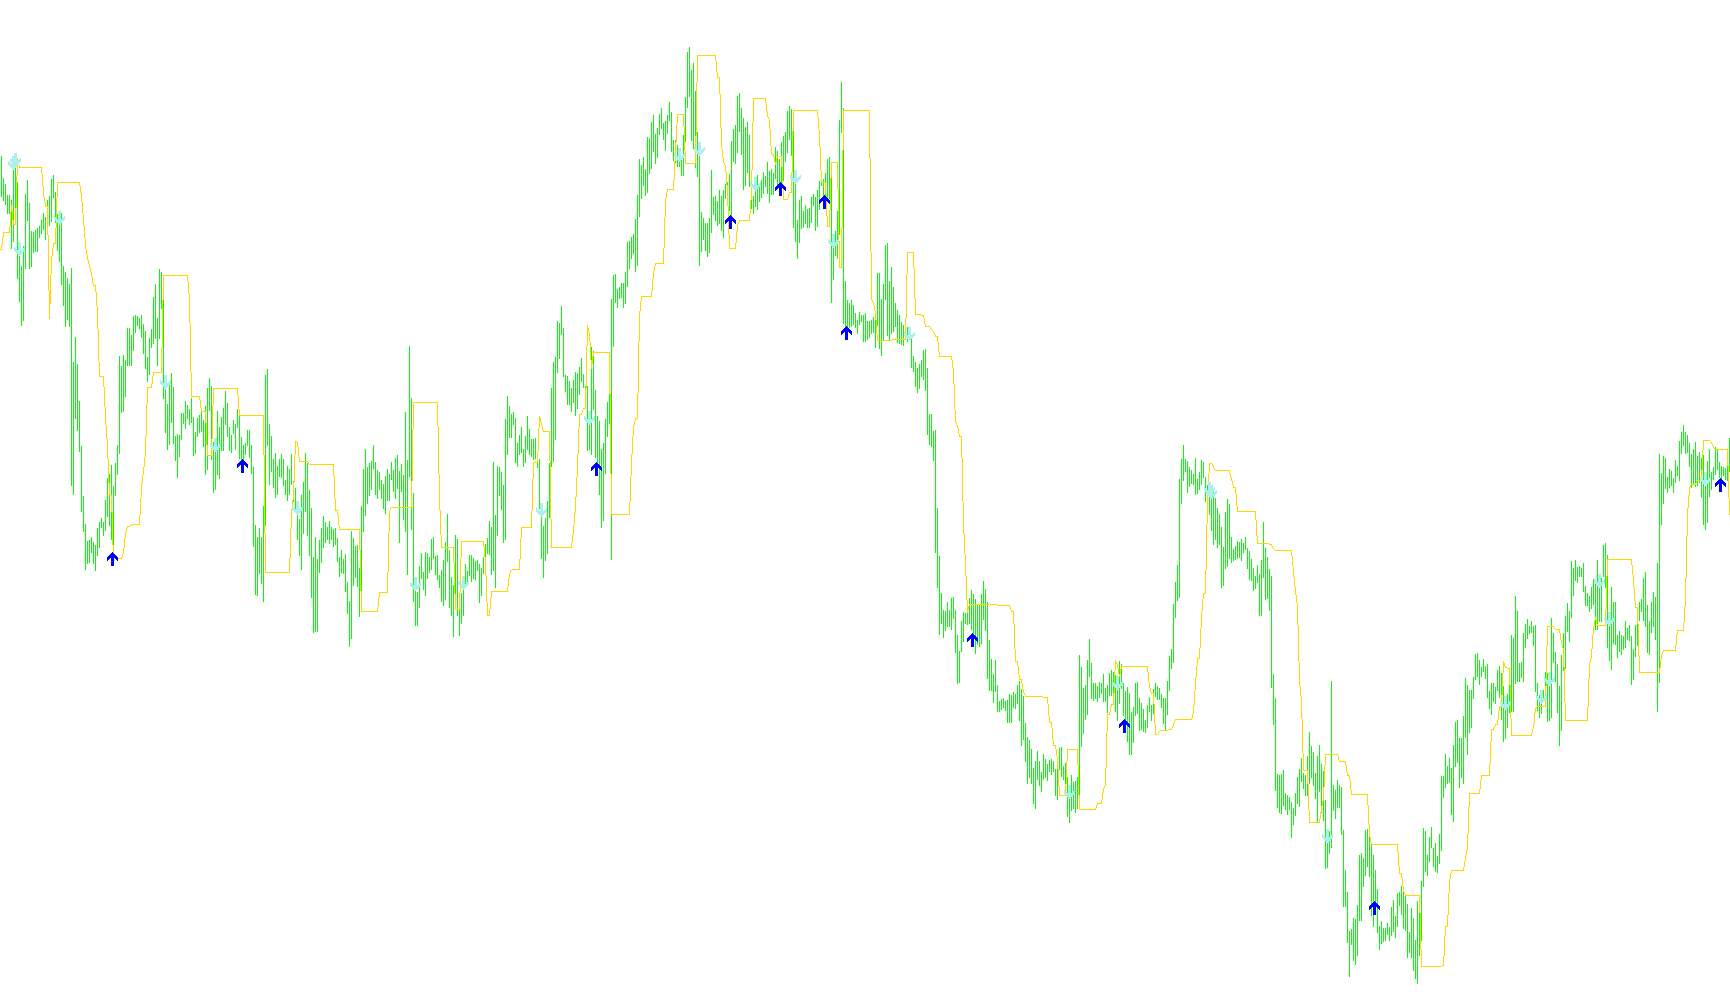
This script is designed as a visual trading tool for the MetaTrader platform, specifically created to help traders identify potential entry points by tracking price momentum and trend shifts. It operates by analyzing price movements over a specific timeframe to determine whether the market is trending upward or downward, then provides visual cues when the price interacts with those trends.
Core Functionality
The logic functions through three primary mechanisms:
1. Dynamic Trend Tracking Instead of using a static average, the script calculates a "Dynamic Line." This line acts as a moving boundary that adjusts based on recent market highs and lows.
- If the current price falls below the previous value of this dynamic line, the script identifies a downward pressure and recalculates the trend based on the highest prices seen over a set period.
- If the price rises above the line, it identifies upward momentum and adjusts the trend based on the lowest prices seen over that same period.
- The sensitivity of these movements is controlled by a percentage factor, ensuring the line stays responsive to market volatility without being overly erratic.
2. Buy and Sell Signal Detection The script continuously monitors the relationship between the current market price and the Dynamic Line. It looks for specific "crossover" events where the price moves from one side of the line to the other:
- Buy Signals: Triggered when the price moves from above the dynamic trend line to below it in a specific sequence, suggesting a potential shift in momentum.
- Sell Signals: Triggered when the price moves from below the dynamic trend line to above it, suggesting an upward break or reversal.
3. Visual and Audio Alerts To ensure the trader doesn't miss these transitions, the script provides immediate feedback:
- Visual Markers: It places specific arrows (Gold for potential buys and Red for potential sells) directly on the chart at the moment a crossover is confirmed.
- Audio Notifications: Every time a valid signal is detected, the system triggers a sound alert to notify the trader instantly.
Summary of User Experience
For a trader, this tool simplifies market analysis by filtering out "noise." Rather than manually watching every price tick, the script automatically draws a trend boundary on your chart and highlights specific moments where the price momentum flips, using both visual arrows and audio cues to signal potential opportunities.
//+------------------------------------------------------------------+
//|                                                      dynamic.mq4 |
//|                      Copyright © 2006, MetaQuotes Software Corp. |
//|                                        http://www.metaquotes.net |
//|                                                                  |
//|   Aug 5, 2006 : Cubesteak : Sound added to arrows                |
//|                  http://www.forex-tsd.com                        |
//+------------------------------------------------------------------+
#property copyright "Copyright © 2006, MetaQuotes Software Corp."
#property link      "http://www.metaquotes.net"

#property indicator_chart_window
#property indicator_buffers 3
#property indicator_color1 Gold // BUY signal
#property indicator_color2 Yellow // BUY signal
#property indicator_color3 Red // SELL signal
//----Indicator Buffers--------------------------------------------+
double DynamicLineTrend []; // Data buffer for dynamic line trend
double BUYSignals []; // Data buffer for BUY signals

double SELLSignals []; // Data buffer for SELL signals //----User defines-------------------------------------------------
extern int Percent=1; // Percent dynamic channel  15  Main Trend 10
extern int MaxPeriod=14; // 12 FOR H1 Maximal period for calculate trend 50 Main Trend 89
 //----Variables----------------------------------------------------+
 int Shift=0;  // Current bar for calculate trend //
//+------------------------------------------------------------------+
//| Custom indicator initialization function                        |
//+------------------------------------------------------------------+
 int init ()
 {
SetIndexStyle (0, DRAW_LINE);
SetIndexBuffer(0, DynamicLineTrend);

SetIndexStyle (1, DRAW_ARROW);
SetIndexArrow (1,233);
SetIndexBuffer(1, BUYSignals);

SetIndexStyle (2, DRAW_ARROW);
SetIndexArrow (2,234);
SetIndexBuffer(2, SELLSignals);
 return (0);
 }
//-------------------------------------------------------------------+

// +------------------------------------------------------------------+
// | Custom indicator iteration function                              |
// +------------------------------------------------------------------+
 int start ()
 {
// Get digits of Symbol
 double point=MarketInfo (Symbol (), MODE_POINT);
// Set count bars for calculate trend
 int Counted_Bars=IndicatorCounted ()-MaxPeriod;
//----Calculation DynamicLineTrend---------------------------------+
   for ( Shift = Counted_Bars; Shift>=0; Shift--)
  {
// Calculate of maximal period
      if (Close [Shift] <DynamicLineTrend [Shift+1])
         {
            // Calculate Upper trend
            DynamicLineTrend [Shift] =Close [Highest (NULL, 0, MODE_CLOSE, MaxPeriod, Shift+1)]-Percent*point;
         }

      if (Close [Shift]>=DynamicLineTrend [Shift+1])
         {
            // Calculate Down trend
               DynamicLineTrend [Shift] =Close [Lowest (NULL, 0, MODE_CLOSE, MaxPeriod, Shift+1)] +Percent*point;
         }

// Checkcrosses DynamicLineTrend and Price
      if (Close [Shift+3]> DynamicLineTrend [Shift+2])
      if (Close [Shift+2] <DynamicLineTrend [Shift+3]){
             BUYSignals [Shift] =Low [Shift]-10*point;
             PlaySound("alert.wav");}
         else
             BUYSignals [Shift] =0;

         else
             BUYSignals [Shift] =0;

      if (Close [Shift+2] <DynamicLineTrend [Shift+1])
      if (Close [Shift+2]> DynamicLineTrend [Shift+3]){
             SELLSignals [Shift] =High [Shift]-10*point;
             PlaySound("alert.wav");}
         else
             SELLSignals [Shift] =0;

         else
             SELLSignals [Shift] =0;
   }
//-------------------------------------------------------------------+
return (0);
}
// ++++++++++++++++++++++++++++++++++++++++++++++++++++++++++++++++++++
Comments