DT-ZigZag_v1
Download script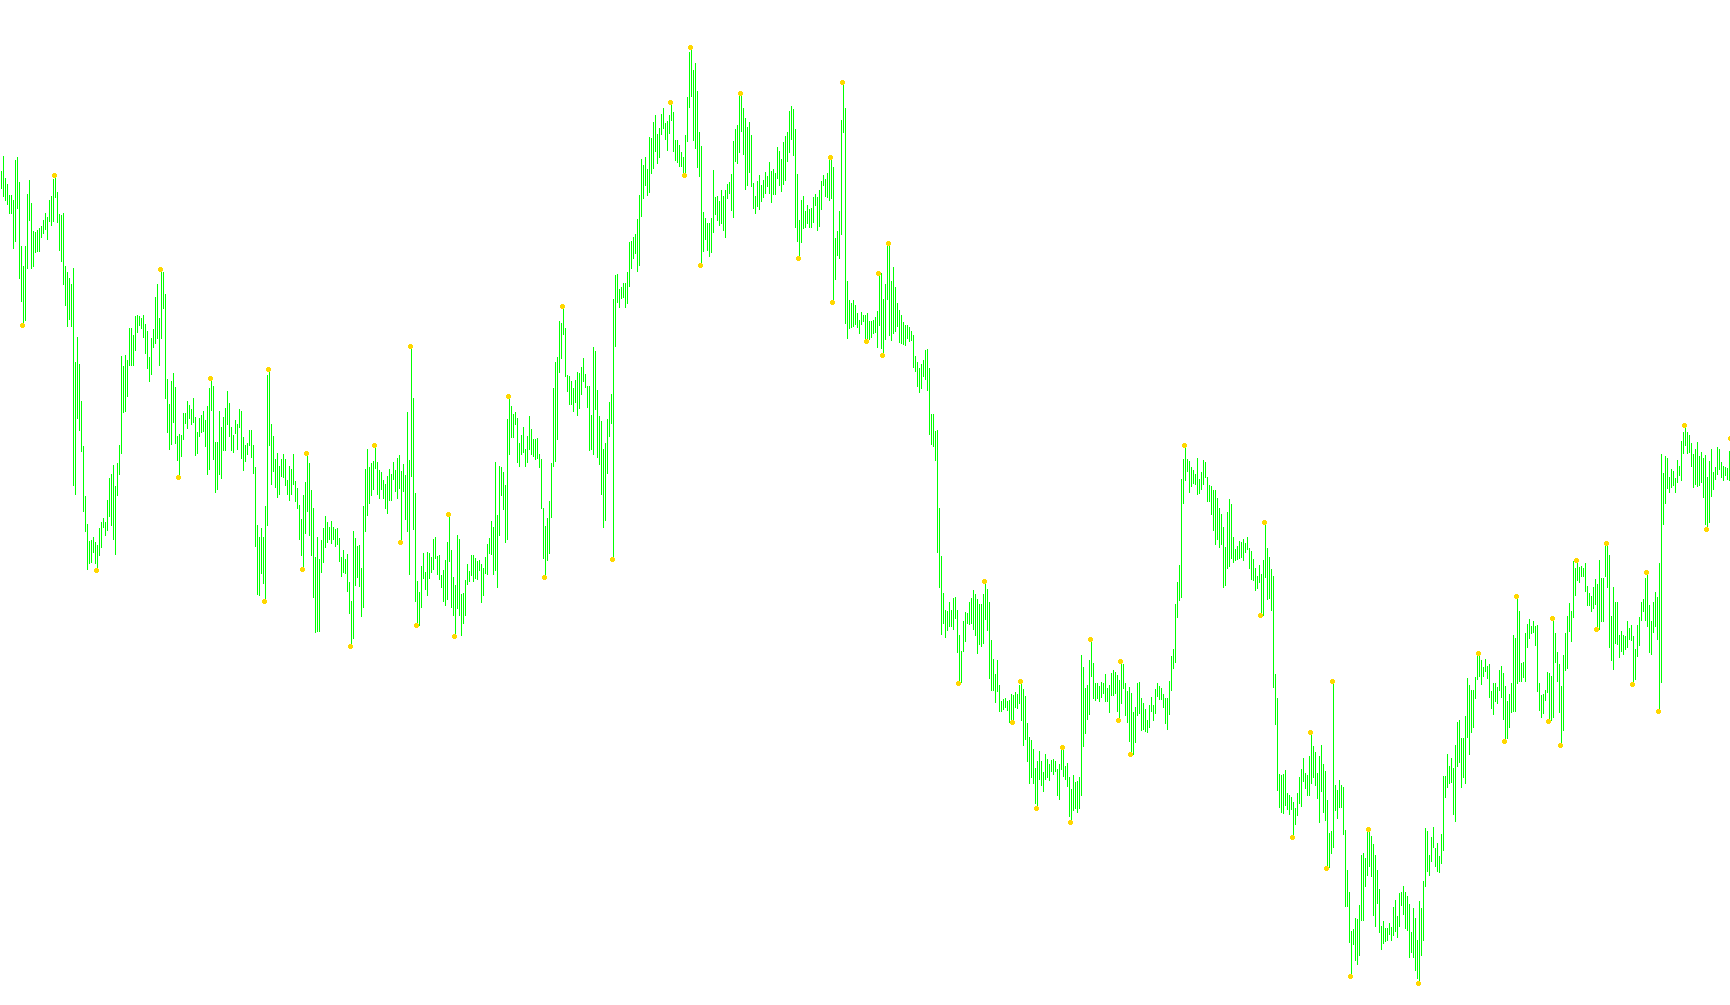
This script is designed to enhance your trading chart by visually identifying significant price trends and structural movements. It functions as a high-level "bridge" that simplifies how market data is displayed, making it easier for traders to see the broader picture without being overwhelmed by minor price fluctuations.
Core Functionality
The primary purpose of this script is to overlay a modified version of the "ZigZag" indicator onto your current chart. While a standard ZigZag might be difficult to interpret across different timeframes, this tool dynamically adjusts itself to ensure that the trend lines you see are consistent and relevant to a larger timeframe (the "Gross Period").
How the Logic Works
The script follows a specific three-step process to determine what information to show on your screen:
1. Timeframe Synchronization The script first checks the timeframe you are currently viewing. If you are looking at a very short time period, it automatically shifts the perspective to a much larger, more stable timeframe (defined by the "Gross Period" setting). This ensures that the trends identified aren't just "noise" from small price changes but represent significant market moves.
2. Intelligent Data Mapping Rather than simply drawing lines on every bar of your current chart, the script performs a "search." It looks back through historical data to find the exact points where the larger timeframe's trend movements occurred. It then maps those specific high and low points onto your current view.
3. Visual Rendering Once the script identifies these significant structural points, it places yellow markers on your chart. These markers highlight the "peaks" and "valleys" of the market. By doing this, the tool allows you to see the overarching structure of the market—where it is heading in the long run—while still viewing the smaller price action of your preferred timeframe.
Summary for the Trader
Think of this script as a "magnifying glass" that keeps one eye on the big picture. It filters out the minor distractions of small-scale price movements and highlights the major turning points of the market. It allows you to trade on a smaller scale while remaining aware of the significant structural trends happening on a much larger scale.
/*-----------------------------+
|			       |
| Shared by www.Aptrafx.com    |
|			       |
+------------------------------*/

//+------------------------------------------------------------------+
//|                                                    DT-ZigZag.mq4 |
//+------------------------------------------------------------------+
#property copyright "klot"
#property link      "klot@mail.ru"

#property indicator_chart_window
#property indicator_buffers 1
#property indicator_color1 Yellow
//---- input parameters
extern int GrossPeriod=60;
extern int ExtDepth=12;
extern int ExtDeviation=5;
extern int ExtBackstep=3;
//---- buffers
double ExtMapBuffer1[];
datetime daytimes[];
//+------------------------------------------------------------------+
//| Custom indicator initialization function                         |
//+------------------------------------------------------------------+
int init()
  {
//---- indicators
   SetIndexStyle(0,DRAW_ARROW);
   SetIndexArrow(0,159);
   SetIndexBuffer(0,ExtMapBuffer1);
   SetIndexEmptyValue(0,0.0);
//----
   if (Period()>GrossPeriod) { Alert("DT-ZigZag: Òåêóùèé òàéìôðåéì äîëæåí áûòü ìåíüøå ÷åì ", GrossPeriod); return(0); }
   // Âñå Time[] ñåðèè âðåìåíè îòñîðòèðîâàíî â íàïðàâëåíèè óáûâàíèÿ
   ArrayCopySeries(daytimes,MODE_TIME,Symbol(),GrossPeriod);
   return(0);
  }
//+------------------------------------------------------------------+
//| Custor indicator deinitialization function                       |
//+------------------------------------------------------------------+
int deinit()
  {
//----

//----
   return(0);
  }
//+------------------------------------------------------------------+
//| Custom indicator iteration function                              |
//+------------------------------------------------------------------+
int start()
  {
   int    limit, bigshift;
   int    counted_bars=IndicatorCounted();
//----
   if (counted_bars<0) return(-1);

   if (counted_bars>0) counted_bars--;

   limit=Bars-counted_bars;

   for (int i=0; i<limit; i++)
   {
   if(Time[i]>=daytimes[0]) bigshift=0;
   else
     {
      bigshift = ArrayBsearch(daytimes,Time[i-1],WHOLE_ARRAY,0,MODE_DESCEND);
      if(Period()<=GrossPeriod) bigshift++;
     }
  ExtMapBuffer1[i]=iCustom(NULL,GrossPeriod,"ZigZag",ExtDepth,ExtDeviation,ExtBackstep,0,bigshift);
   }
//----
   return(0);
  }
//+------------------------------------------------------------------+
Comments