DT-ZigZag_006
Download script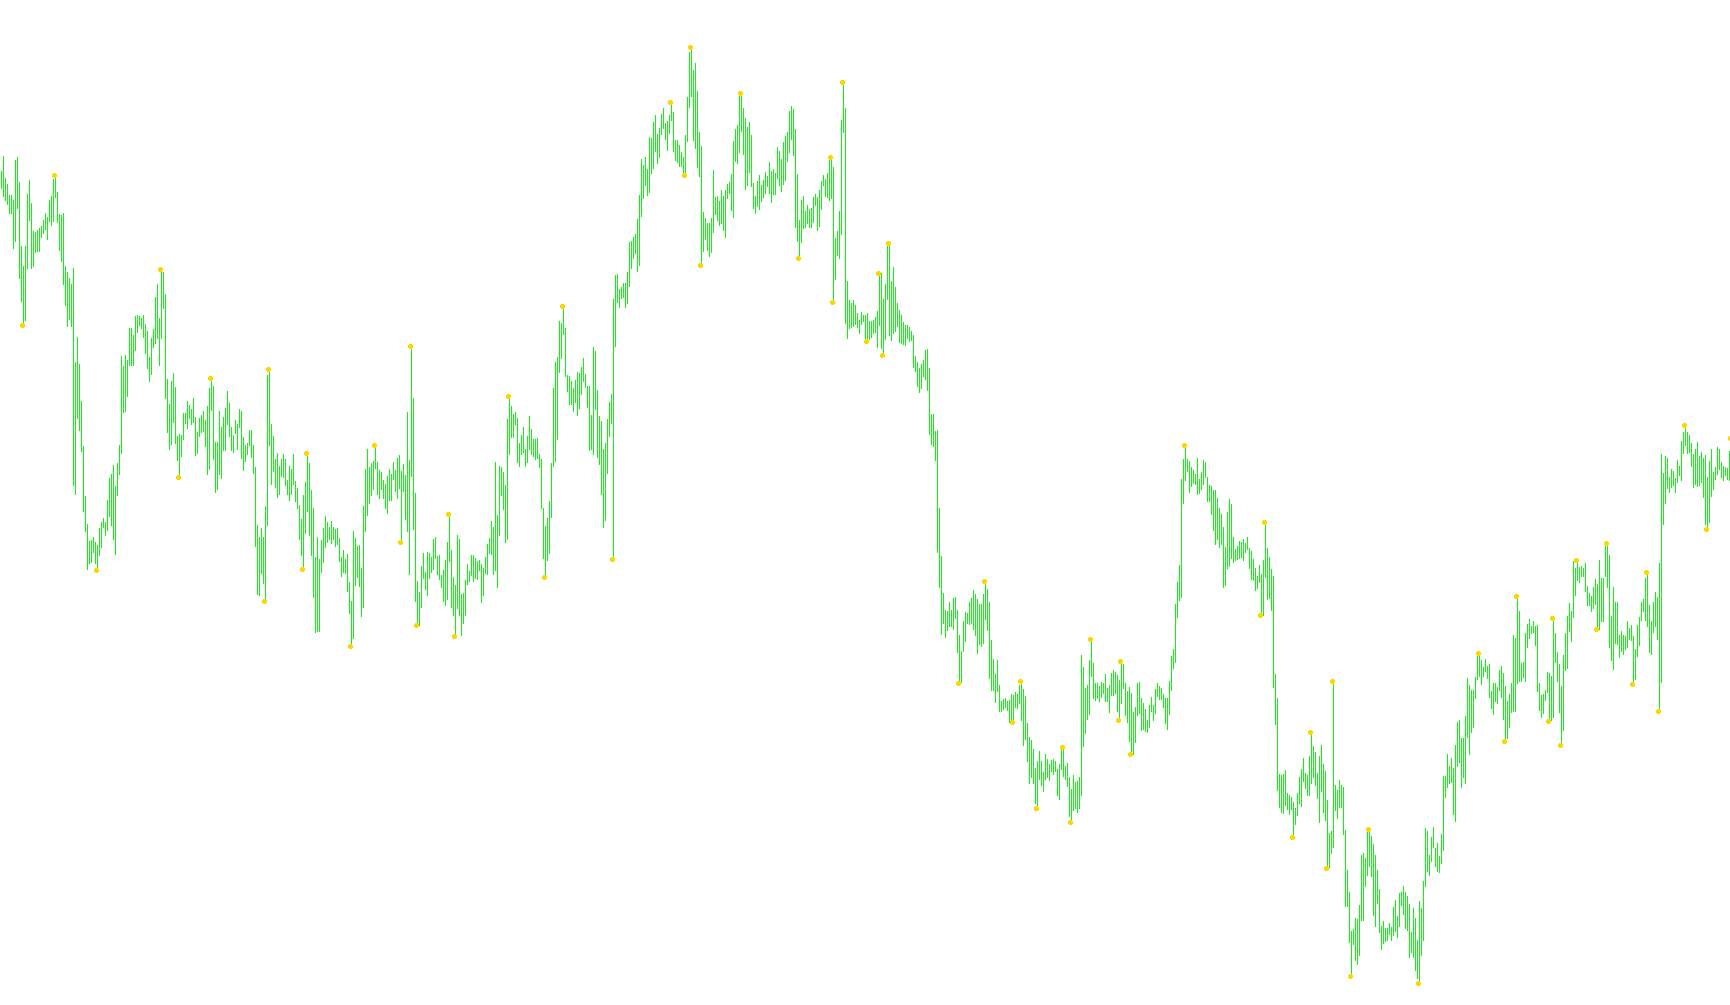
The DT-ZigZag tool is a sophisticated technical analysis indicator designed to simplify the identification of significant price movements and structural trends on a trading chart. Its primary purpose is to filter out "market noise"—the small, insignificant price fluctuations—to reveal the core direction of the market.
Core Logic Overview
The script functions by synchronizing data from different timeframes. It takes the standard ZigZag calculation (a common tool used to highlight major highs and lows) and applies it through a multi-layered perspective. Instead of just looking at the current chart, it calculates movements based on a larger, overarching timeframe defined by the user.
Key Functional Components
-
Timeframe Synchronization: The script is designed to look "upstream." It automatically identifies a higher timeframe (the Gross Period) and pulls data from there to inform the current chart. This allows a trader to see how the big picture affects the smaller price movements they are watching in real-time.
-
Dynamic Data Alignment: One of the complex tasks this script performs is "alignment." Because different timeframes have different numbers of candles, the script uses a search logic to ensure that the data from the larger timeframe perfectly matches the current point in time on your screen. It calculates exactly where the current price sits within the historical data of the larger timeframe to ensure the information displayed is accurate and relevant.
-
Smart Filtering: By utilizing the standard ZigZag parameters (Depth, Deviation, and Backstep), the script ensures that only significant "swings" are highlighted. It ignores minor retracements, helping traders identify the major turning points where the market's momentum might be shifting.
How it Benefits the Trader
For a non-technical user, this tool acts as a "macro-lens." While most indicators show you what is happening now on your current screen, this script tells you how the current price relates to the larger market structure. It helps in:
- Identifying Trend Reversals: Clearly marking major peaks and valleys.
- Contextual Awareness: Providing a visual cue of whether the current price action is supported by the broader market trend.
- Cleaner Charts: By focusing on significant structural points, it reduces visual clutter, allowing for clearer decision-making.
//+------------------------------------------------------------------+
//|                                                    DT-ZigZag.mq4 |
//+------------------------------------------------------------------+
#property copyright "klot"
#property link      "klot@mail.ru"

#property indicator_chart_window
#property indicator_buffers 1
#property indicator_color1 Yellow
//---- input parameters
extern int GrossPeriod=60;
extern int ExtDepth=12;
extern int ExtDeviation=5;
extern int ExtBackstep=3;
//---- buffers
double ExtMapBuffer1[];
datetime daytimes[];
//+------------------------------------------------------------------+
//| Custom indicator initialization function                         |
//+------------------------------------------------------------------+
int init()
  {
//---- indicators
   SetIndexStyle(0,DRAW_ARROW);
   SetIndexArrow(0,159);
   SetIndexBuffer(0,ExtMapBuffer1);
   SetIndexEmptyValue(0,0.0);
//----
   if (Period()>GrossPeriod) { Alert("DT-ZigZag: Òåêóùèé òàéìôðåéì äîëæåí áûòü ìåíüøå ÷åì ", GrossPeriod); return(0); }
   // Âñå Time[] ñåðèè âðåìåíè îòñîðòèðîâàíî â íàïðàâëåíèè óáûâàíèÿ
   ArrayCopySeries(daytimes,MODE_TIME,Symbol(),GrossPeriod);
   return(0);
  }
//+------------------------------------------------------------------+
//| Custor indicator deinitialization function                       |
//+------------------------------------------------------------------+
int deinit()
  {
//----

//----
   return(0);
  }
//+------------------------------------------------------------------+
//| Custom indicator iteration function                              |
//+------------------------------------------------------------------+
int start()
  {
   int    limit, bigshift;
   int    counted_bars=IndicatorCounted();
//----
   if (counted_bars<0) return(-1);

   if (counted_bars>0) counted_bars--;

   limit=Bars-counted_bars;

   for (int i=0; i<limit; i++)
   {
   if(Time[i]>=daytimes[0]) bigshift=0;
   else
     {
      bigshift = ArrayBsearch(daytimes,Time[i-1],WHOLE_ARRAY,0,MODE_DESCEND);
      if(Period()<=GrossPeriod) bigshift++;
     }
  ExtMapBuffer1[i]=iCustom(NULL,GrossPeriod,"ZigZag",ExtDepth,ExtDeviation,ExtBackstep,0,bigshift);
   }
//----
   return(0);
  }
//+------------------------------------------------------------------+
Comments