DT_ZZ_004
Download script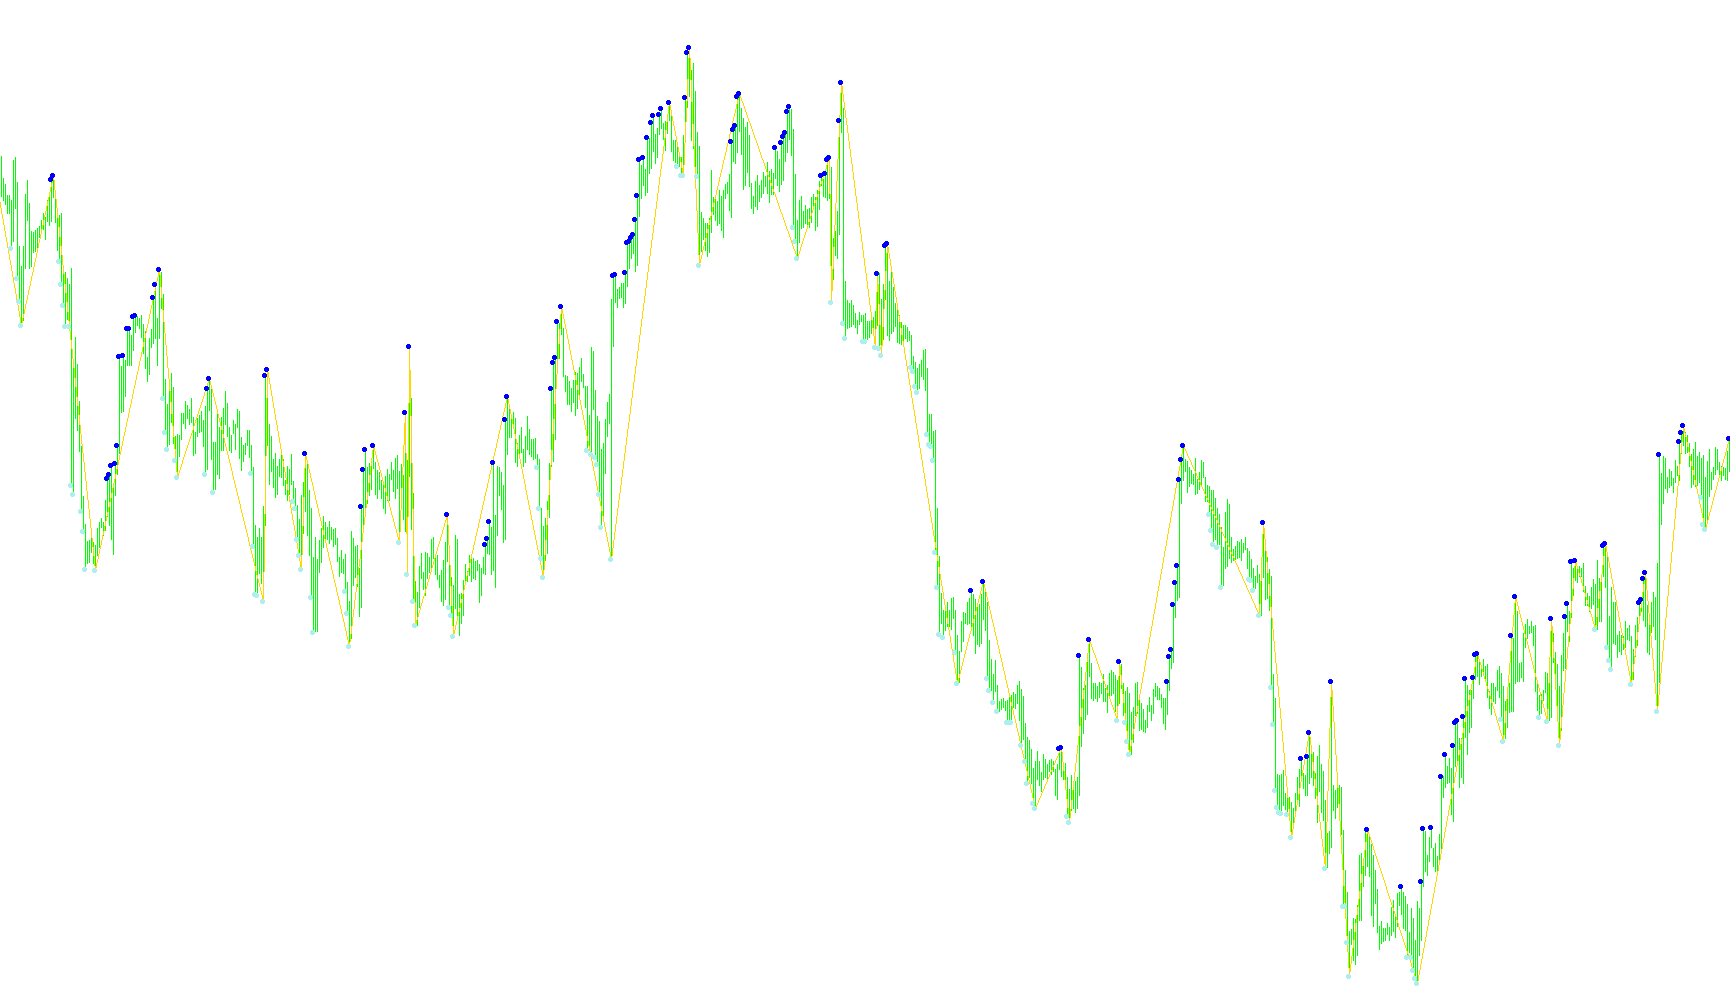
This tool is designed to help traders visualize significant price structural points on a trading chart by identifying specific historical peaks and valleys. It functions by analyzing price action over a moving window of time to distinguish between minor market noise and substantial turning points.
Core Logic and Methodology
The script operates by scanning the market history using a user-defined "depth" (a lookback period). This depth determines how many recent candles the tool considers when looking for new highs or lows.
How it identifies key points:
- Scanning for Extremes: The tool continuously looks for the highest price and the lowest price within its designated window.
- Trend Break Identification: It monitors these extremes as they move across the chart. A "break" is triggered when the current high or low exceeds the previous extreme recorded by the script.
- Filtering and Confirmation: To ensure it doesn't mark every small fluctuation, the script applies a logic check: it only confirms a new high or low if it occurs in a specific sequence relative to the preceding movement.
- Visualizing Structure: Once a significant move is confirmed, the tool marks these points on your chart. It effectively separates the "major" price levels from the "minor" ones, allowing you to see the broader skeleton of the market's movement.
Key Features for the Trader
- Dynamic Tracking: Instead of looking at static historical data, the script processes price movements dynamically as new candles form, updating the identified points in real-time.
- Structural Clarity: By highlighting these specific highs and lows, the tool helps traders identify areas of potential support and resistance where the market has shown significant reaction in the past.
- Customizable Sensitivity: The "Depth" parameter allows you to adjust how "aggressive" or "conservative" the indicator is. A higher depth will result in identifying larger, more significant structural shifts, while a lower depth will pick up smaller price fluctuations.
In summary, this script acts as a visual filter for market structure, automatically highlighting the most relevant price peaks and valleys based on your preferred lookback sensitivity.
Miscellaneous
16
Views
0
Downloads
0
Favorites
DT_ZZ_004
//+------------------------------------------------------------------+
//|                                                        DT_ZZ.mq4 |
//+------------------------------------------------------------------+
#property copyright "Copyright © 2006, klot."
#property link      "klot@mail.ru"

#property indicator_chart_window
#property indicator_buffers 3
#property indicator_color1 Aqua
#property indicator_color2 Blue
#property indicator_color3 Red
//---- indicator parameters
extern int ExtDepth=12;
//---- indicator buffers
double zzL[];
double zzH[];
double zz[];

//+------------------------------------------------------------------+
//| Custom indicator initialization function                         |
//+------------------------------------------------------------------+
int init()
  {
 //  IndicatorBuffers(3);
//---- drawing settings
   SetIndexStyle(2,DRAW_ARROW);
   SetIndexStyle(1,DRAW_ARROW);
   SetIndexStyle(0,DRAW_SECTION);
   SetIndexArrow(2,159);
   SetIndexArrow(1,159);
//---- indicator buffers mapping
   SetIndexBuffer(0,zz);
   SetIndexBuffer(1,zzH);
   SetIndexBuffer(2,zzL);
   SetIndexEmptyValue(0,0.0);
   SetIndexEmptyValue(1,0.0);
   SetIndexEmptyValue(2,0.0);

//---- indicator short name
   IndicatorShortName("DT_ZZ("+ExtDepth+")");
//---- initialization done
   return(0);
  }
//+------------------------------------------------------------------+
//|                                                                  |
//+------------------------------------------------------------------+
int start()
  {
   int    i,shift,pos,lasthighpos,lastlowpos,curhighpos,curlowpos;
   double curlow,curhigh,lasthigh,lastlow;
   double min, max;
   ArrayInitialize(zz,0.0);
   ArrayInitialize(zzL,0.0);
   ArrayInitialize(zzH,0.0);

   lasthighpos=Bars; lastlowpos=Bars;
   lastlow=Low[Bars];lasthigh=High[Bars];
  for(shift=Bars-ExtDepth; shift>=0; shift--)
    {
      curlowpos=Lowest(NULL,0,MODE_LOW,ExtDepth,shift);
      curlow=Low[curlowpos];
      curhighpos=Highest(NULL,0,MODE_HIGH,ExtDepth,shift);
      curhigh=High[curhighpos];
      //------------------------------------------------
      if( curlow>=lastlow ) { lastlow=curlow; }
      else
         {
            //èäåì âíèç
            if( lasthighpos>curlowpos  )
            {
            zzL[curlowpos]=curlow;
              ///*
              min=100000; pos=lasthighpos;
               for(i=lasthighpos; i>=curlowpos; i--)
                  {
                    if (zzL[i]==0.0) continue;
                    if (zzL[i]<min) { min=zzL[i]; pos=i; }
                    zz[i]=0.0;
                  }
               zz[pos]=min;
               //*/
            }
          lastlowpos=curlowpos;
          lastlow=curlow;
         }
      //--- high
      if( curhigh<=lasthigh )  { lasthigh=curhigh;}
      else
         {
            // èäåì ââåðõ
            if( lastlowpos>curhighpos )
            {
            zzH[curhighpos]=curhigh;
           ///*
               max=-100000; pos=lastlowpos;
               for(i=lastlowpos; i>=curhighpos; i--)
                  {
                    if (zzH[i]==0.0) continue;
                    if (zzH[i]>max) { max=zzH[i]; pos=i; }
                    zz[i]=0.0;
                  }
               zz[pos]=max;
           //*/
            }
         lasthighpos=curhighpos;
         lasthigh=curhigh;
         }
    //----------------------------------------------------------------------
    }
 return(0);
}
//+------------------------------------------------------------------+
Comments