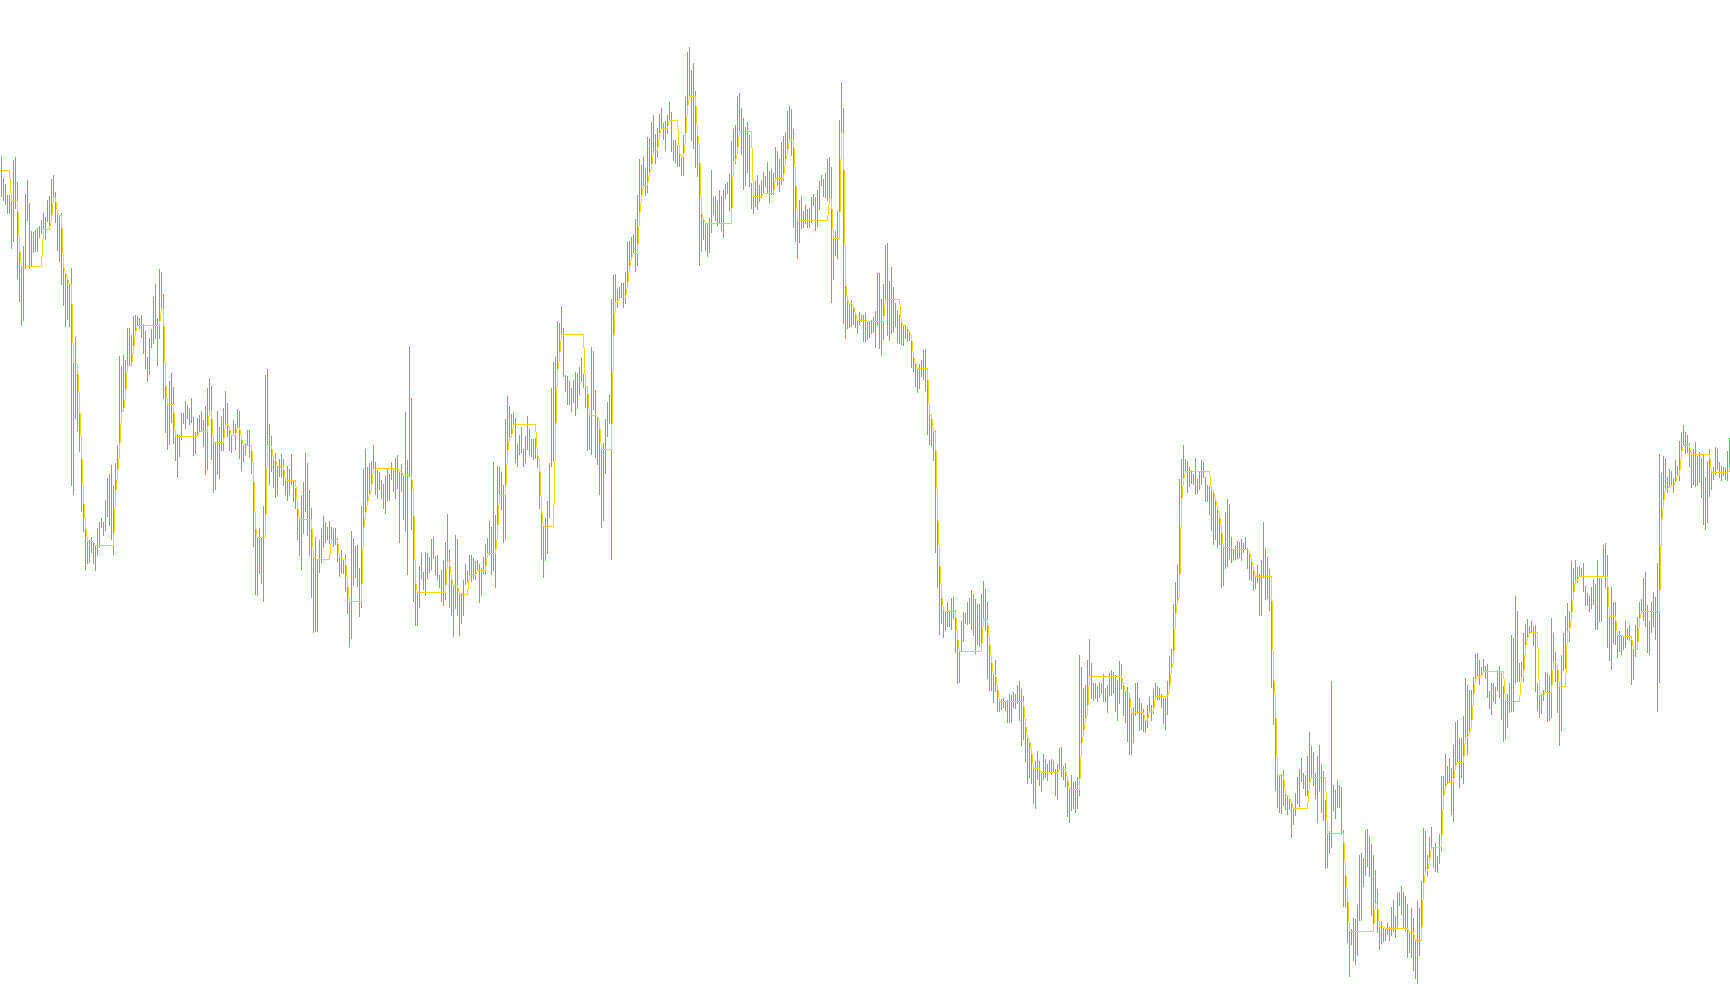
This script is designed as a visual trading tool that tracks significant price fluctuations on a market chart. Instead of showing every minor movement, it identifies and connects specific "peaks" and "troughs" to help traders visualize the overarching structure of the market.
How the Logic Works
The core functionality of this tool relies on three main principles: identifying new highs or lows, comparing them against historical data, and maintaining a continuous visual line.
1. Identifying Market Extremes The script constantly scans the price action to see if the current price has reached a new point relative to its immediate past. Specifically, it looks for moments where the "High" of a candle is lower than both the previous candle and a specific historical window (defined by a user-set period). Similarly, it looks for "Lows" that are higher than the previous candle and the historical window.
2. Establishing New Boundaries The tool acts as a filter to ensure that only meaningful price changes are captured:
- For Downward Trends: If the market hits a new low that is also lower than the previous significant point recorded by the script, it updates the visual line to this new level.
- For Upward Trends: If the market hits a new high that is higher than the previous significant point recorded by the script, it updates the visual line to this new level.
3. Maintaining Continuity One of the key features of this logic is how it handles "quiet" market periods. When the price is moving sideways or doesn't meet the specific criteria to form a new peak or trough, the script does not break the line. Instead, it carries over the value from the previous point. This ensures that the resulting visual indicator is a smooth, unbroken line that clearly maps out the "path" of the market's significant price shifts.
Summary for the User
In simple terms, this tool ignores the "noise" of small daily fluctuations. It focuses on capturing the major turning points of the market. By connecting these significant highs and lows into a single continuous line, it provides a clear visual representation of the trend, making it easier to see where the price is structurally moving over time.
//+------------------------------------------------------------------+
//|                                                    DynamicRS.mq4 |
//|                                 Copyright © 2007, Nick A. Zhilin |
//|                                                  rebus58@mail.ru |
//+------------------------------------------------------------------+
#property copyright "Copyright © 2007, Nick A. Zhilin"
#property link      "rebus58@mail.ru"

extern int IPeriod=16;

#property indicator_chart_window
#property indicator_buffers 1
#property indicator_color1 Yellow

//---- buffers
double ExtMapBuffer1[];

//+------------------------------------------------------------------+
//| Custom indicator initialization function                         |
//+------------------------------------------------------------------+
int init()
  {
   IndicatorShortName("DynamicRS");
//---- indicators
   SetIndexStyle(0,DRAW_LINE);
   SetIndexBuffer(0,ExtMapBuffer1);
//----
   return(0);
  }
//+------------------------------------------------------------------+
//| DynamicRS                                                        |
//+------------------------------------------------------------------+
int start()
  {
   int i,counted_bars=IndicatorCounted();

//----
   i=Bars-counted_bars-1;
   while(i>=0)
     {
      if(High[i]<High[i+1] && High[i]<High[i+IPeriod] && High[i]<ExtMapBuffer1[i+1])
         ExtMapBuffer1[i]=High[i];
      else if(Low[i]>Low[i+1] && Low[i]>Low[i+IPeriod] && Low[i]>ExtMapBuffer1[i+1])
         ExtMapBuffer1[i]=Low[i];
      else
         ExtMapBuffer1[i]=ExtMapBuffer1[i+1];

      i--;
     }


//----
   return(0);
  }
//+------------------------------------------------------------------+
Comments