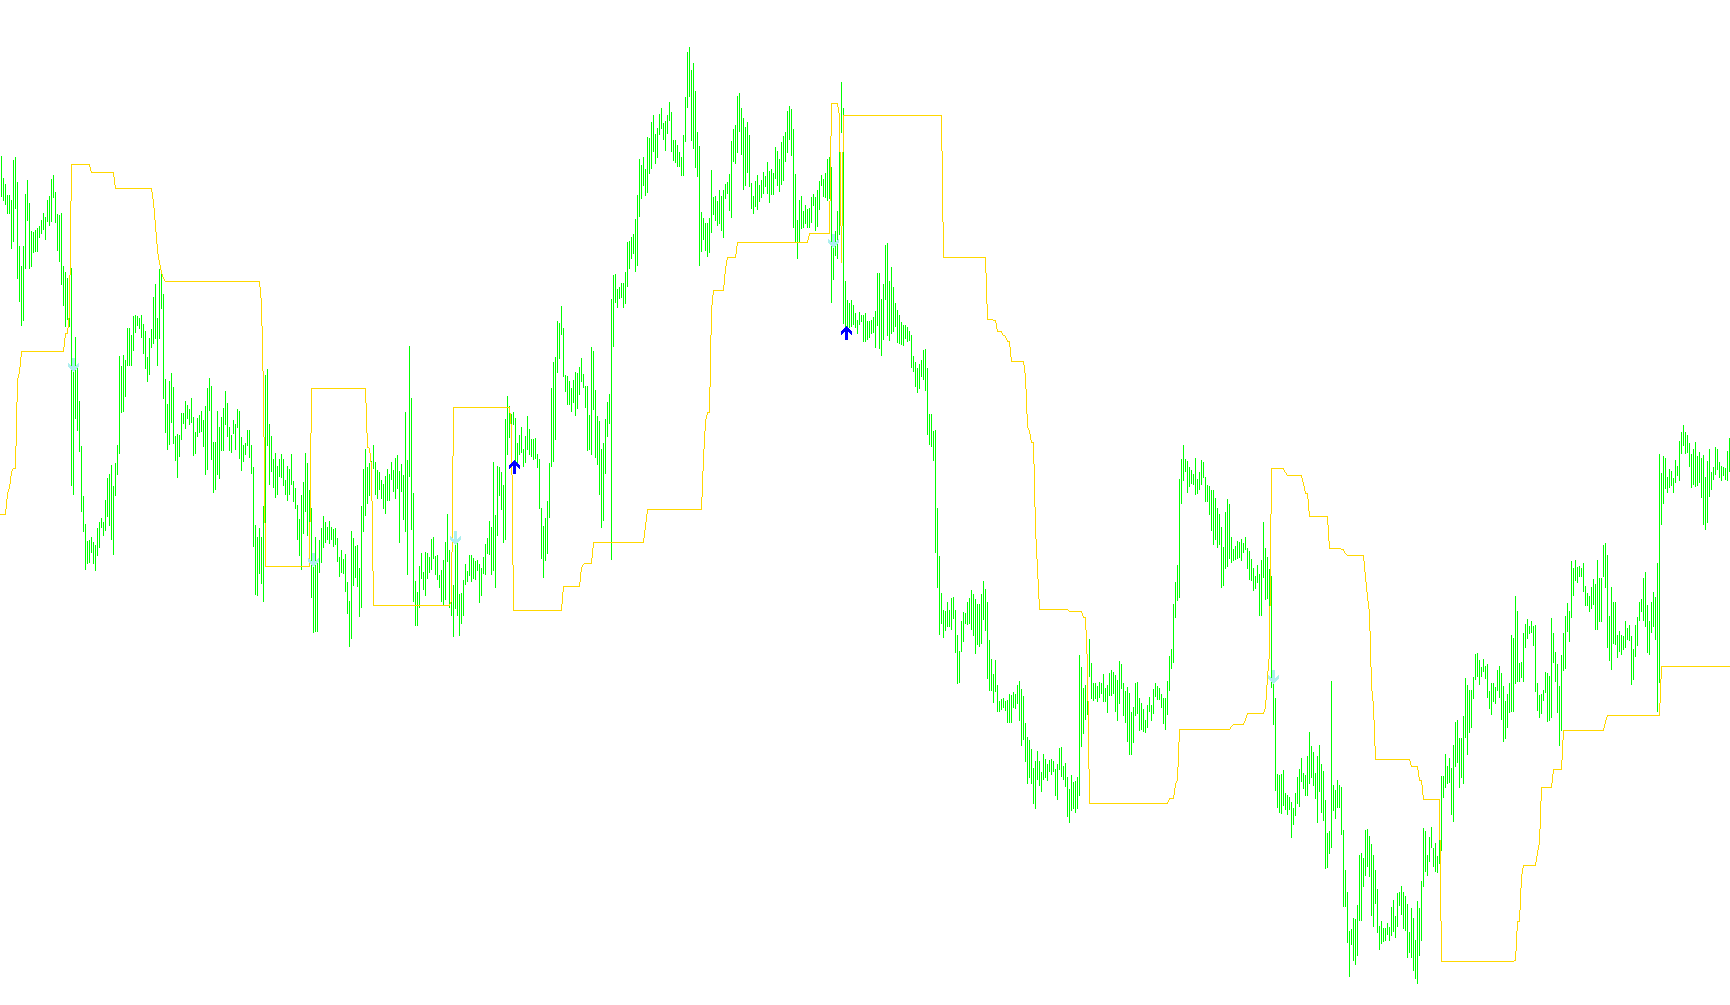
This indicator is designed to help traders visualize price momentum and identify specific entry points by monitoring how the market price interacts with a "Dynamic Price Channel." Instead of relying on standard static moving averages, this tool creates a reactive boundary that adjusts based on recent high and low price action.
Core Logic & Dynamics
The Dynamic Trend Line The heart of this script is a shifting trend line that constantly recalculates its position based on two distinct market conditions:
- Downward Momentum: When the current price falls below the established trend line, the tool identifies a potential bearish movement. It then sets a new "ceiling" by looking back at the highest closing prices over a specific period (the MaxPeriod) and subtracting a small percentage buffer.
- Upward Momentum: Conversely, when the price rises above the trend line, the tool recognizes bullish momentum. It establishes a new "floor" by finding the lowest closing prices over that same period and adding a small percentage buffer.
This creates a "breathing" channel that follows the price but provides a cushion, ensuring that minor fluctuations don't trigger false signals while still reacting quickly to significant shifts in market direction.
Signal Generation (Buy and Sell Alerts) The script identifies trading opportunities by detecting "crosses"—moments where the price breaks through these dynamic boundaries. It uses a multi-bar confirmation logic to filter out market noise:
- Buy Signals: The indicator looks for instances where the price moves from below the trend line to above it. Specifically, it monitors a sequence of price movements over three bars to confirm that the "breakout" is genuine before placing a visual arrow on the chart.
- Sell Signals: Similarly, the indicator watches for the price dropping from above the trend line to below it. It validates this drop across several bars to ensure the downward move has enough strength to be considered a valid signal.
User Customization
The behavior of the script is controlled by two primary settings:
- Percent: This defines the size of the "buffer" or gap between the price extremes and the trend line, allowing you to make the channel tighter or wider.
- MaxPeriod: This determines how far back into the past the script looks to find its high and low points. A larger period creates a smoother, more stable line, while a smaller period makes the indicator much more sensitive to immediate price changes.
// +------------------------------------------------------------------+
// | The percentage indicator basis on break |
// | of the dynamic price channel |
// | BDPC_Percent.mq4 |
// | Copyright © 2004, OfficeFX Group |
// | http: // officefx.nm.ru |
// +------------------------------------------------------------------+
#property copyright " Copyright © 2004, OfficeFX Group "
#property link " http:// officefx.nm.ru "

#property indicator_chart_window
#property indicator_buffers 3
#property indicator_color1 Yellow // BUY signal
#property indicator_color2 Blue // BUY signal
#property indicator_color3 Red // SELL signal
//----Indicator Buffers--------------------------------------------+
double DynamicLineTrend []; // Data buffer for dynamic line trend
double BUYSignals []; // Data buffer for BUY signals

double SELLSignals []; // Data buffer for SELL signals //----User defines-------------------------------------------------
extern int Percent=15; // Percent dynamic channel
extern int MaxPeriod=50; // Maximal period for calculate trend
 //----Variables----------------------------------------------------+
 int Shift=0;  // Current bar for calculate trend //
//+------------------------------------------------------------------+
// | Custom indicator initialization function |
//+------------------------------------------------------------------+
 int init ()
 {
SetIndexStyle (0, DRAW_LINE);
SetIndexBuffer(0, DynamicLineTrend);

SetIndexStyle (1, DRAW_ARROW);
SetIndexArrow (1,233);
SetIndexBuffer(1, BUYSignals);

SetIndexStyle (2, DRAW_ARROW);
SetIndexArrow (2,234);
SetIndexBuffer(2, SELLSignals);
 return (0);
 }
//-------------------------------------------------------------------+

// +------------------------------------------------------------------+
// | Custom indicator iteration function |
// +------------------------------------------------------------------+
 int start ()
 {
// Get digits of Symbol
 double point=MarketInfo (Symbol (), MODE_POINT);
// Set count bars for calculate trend
 int Counted_Bars=IndicatorCounted ()-MaxPeriod;
//----Calculation DynamicLineTrend---------------------------------+
   for ( Shift = Counted_Bars; Shift>=0; Shift--)
  {
// Calculate of maximal period
      if (Close [Shift] <DynamicLineTrend [Shift+1])
         {
            // Calculate Upper trend
            DynamicLineTrend [Shift] =Close [Highest (NULL, 0, MODE_CLOSE, MaxPeriod, Shift+1)]-Percent*point;
         }

      if (Close [Shift]>=DynamicLineTrend [Shift+1])
         {
            // Calculate Down trend
               DynamicLineTrend [Shift] =Close [Lowest (NULL, 0, MODE_CLOSE, MaxPeriod, Shift+1)] +Percent*point;
         }

// Checkcrosses DynamicLineTrend and Price
      if (Close [Shift+3]> DynamicLineTrend [Shift+2])
      if (Close [Shift+2] <DynamicLineTrend [Shift+3])
             BUYSignals [Shift] =Low [Shift]-10*point;
         else
             BUYSignals [Shift] =0;

         else
             BUYSignals [Shift] =0;

      if (Close [Shift+2] <DynamicLineTrend [Shift+1])
      if (Close [Shift+2]> DynamicLineTrend [Shift+3])
             SELLSignals [Shift] =High [Shift]-10*point;
         else
             SELLSignals [Shift] =0;

         else
             SELLSignals [Shift] =0;
   }
//-------------------------------------------------------------------+
return (0);
}
// ++++++++++++++++++++++++++++++++++++++++++++++++++++++++++++++++++++
Comments