Dynamic Zone RSI_v1
Download script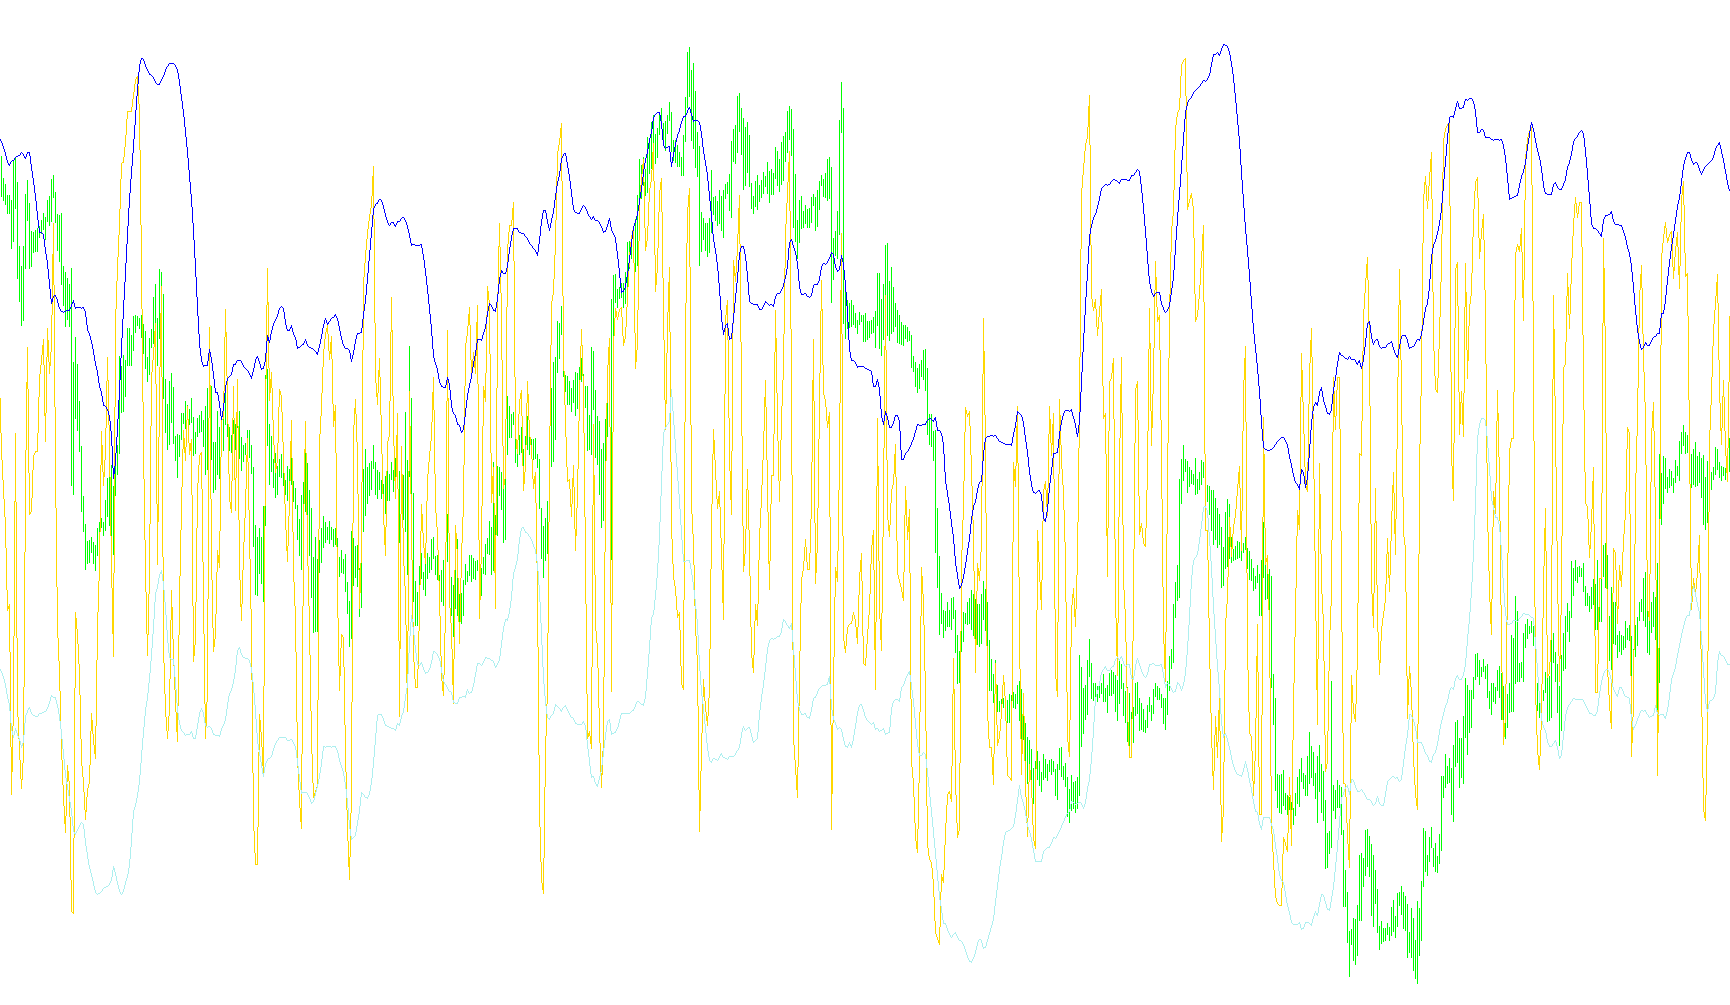
The Dynamic Zone RSI is a specialized technical analysis tool designed to help traders identify overbought and oversold conditions by adding a layer of "smart" volatility adjustment to the standard Relative Strength Index (RSI).
Core Functionality
Unlike a traditional RSI, which uses fixed horizontal lines (typically at 70 and 30) to signal extremes, this script creates a moving, flexible boundary. It adapts to the current market environment, meaning the "zones" expand when the market is volatile and contract when the market is calm.
How the Logic Works
The indicator operates through three distinct layers of calculation:
1. The Base Momentum (RSI) First, the script calculates the standard RSI. This tracks the speed and change of price movements over a short, user-defined period to determine the current momentum of the asset.
2. The Moving Average Overlay Instead of looking at the RSI in isolation, the script calculates a "Moving Average" of the RSI values themselves over a longer period. This acts as a baseline, smoothing out minor fluctuations to reveal the primary trend of the momentum.
3. Dynamic Volatility Bands (The Zones) This is where the tool becomes unique. The script measures the "Standard Deviation"—a mathematical way to calculate how much the RSI is swinging up and down. It then uses this data to project two dynamic boundaries (Upper and Lower Zones) above and below the RSI moving average:
- Upper Zone: Represents the ceiling of normal price action. When the RSI breaches this zone, it suggests a strong upward move that may be reaching an extreme point.
- Lower Zone: Represents the floor of normal price action. When the RSI drops below this, it indicates a significant downward move that might be overextended.
Summary for Traders
By using these dynamic zones instead of fixed lines, the tool helps filter out "fakeouts." In highly volatile markets, the zones will widen to account for large swings, preventing premature trade signals. In quieter markets, the zones tighten, allowing for more precise entries during subtle momentum shifts. This provides a more nuanced view of market exhaustion compared to standard technical indicators.
/*-----------------------------+
|			       |
| Shared by www.Aptrafx.com    |
|			       |
+------------------------------*/

//+------------------------------------------------------------------+
//|                                             Dynamic Zone RSI.mq4 |
//|                                   Copyright © 2005, Pavel Kulko. |
//|                                                  polk@alba.dp.ua |
//+------------------------------------------------------------------+
#property copyright "Copyright © 2005, Pavel Kulko"
#property link      "polk@alba.dp.ua"
#property indicator_buffers 3
#property indicator_color1 Lime
#property indicator_color2 SlateBlue
#property indicator_color3 Orange

#property indicator_separate_window

extern int RSIPeriod = 5;
extern int BandPeriod = 30;

double RSIBuf[],UpZone[],DnZone[];
//+------------------------------------------------------------------+
//| Custom indicator initialization function                         |
//+------------------------------------------------------------------+
int init()
  {
//---- indicators
   SetIndexStyle(0,DRAW_LINE);
   SetIndexStyle(1,DRAW_LINE);
   SetIndexStyle(2,DRAW_LINE);
   SetIndexBuffer(0,RSIBuf);
   SetIndexBuffer(1,UpZone);
   SetIndexBuffer(2,DnZone);
//----
   return(0);
  }
//+------------------------------------------------------------------+
//| Custor indicator deinitialization function                       |
//+------------------------------------------------------------------+
int deinit()
  {
//----

//----
   return(0);
  }
//+------------------------------------------------------------------+
//| Custom indicator iteration function                              |
//+------------------------------------------------------------------+
int start()
  {
   double MA, RSI[];
   ArrayResize(RSI,BandPeriod);
   int counted_bars=IndicatorCounted();
   int limit = Bars-counted_bars-1;
   for(int i=limit; i>=0; i--)
   {
      RSIBuf[i] = iRSI(NULL,0,RSIPeriod,MODE_CLOSE,i);
      MA = 0;
      for(int j=i; j<i+BandPeriod; j++) {
         RSI[j-i] = RSIBuf[j];
         MA += RSIBuf[j]/BandPeriod;
      }
      UpZone[i] = MA + (1.3185 * StDev(RSI,BandPeriod));
      DnZone[i] = MA - (1.3185 * StDev(RSI,BandPeriod));
   }

//----
   return(0);
  }

double StDev(double& Data[], int Per)
{
  return(MathSqrt(Variance(Data,Per)));
}

double Variance(double& Data[], int Per)
{
  double sum, ssum;
  for (int i=0; i<Per; i++)
  {
    sum += Data[i];
    ssum += MathPow(Data[i],2);
  }
  return((ssum*Per - sum*sum)/(Per*(Per-1)));
}
//+------------------------------------------------------------------+
Comments