Dynamic Zone RSI2
Download script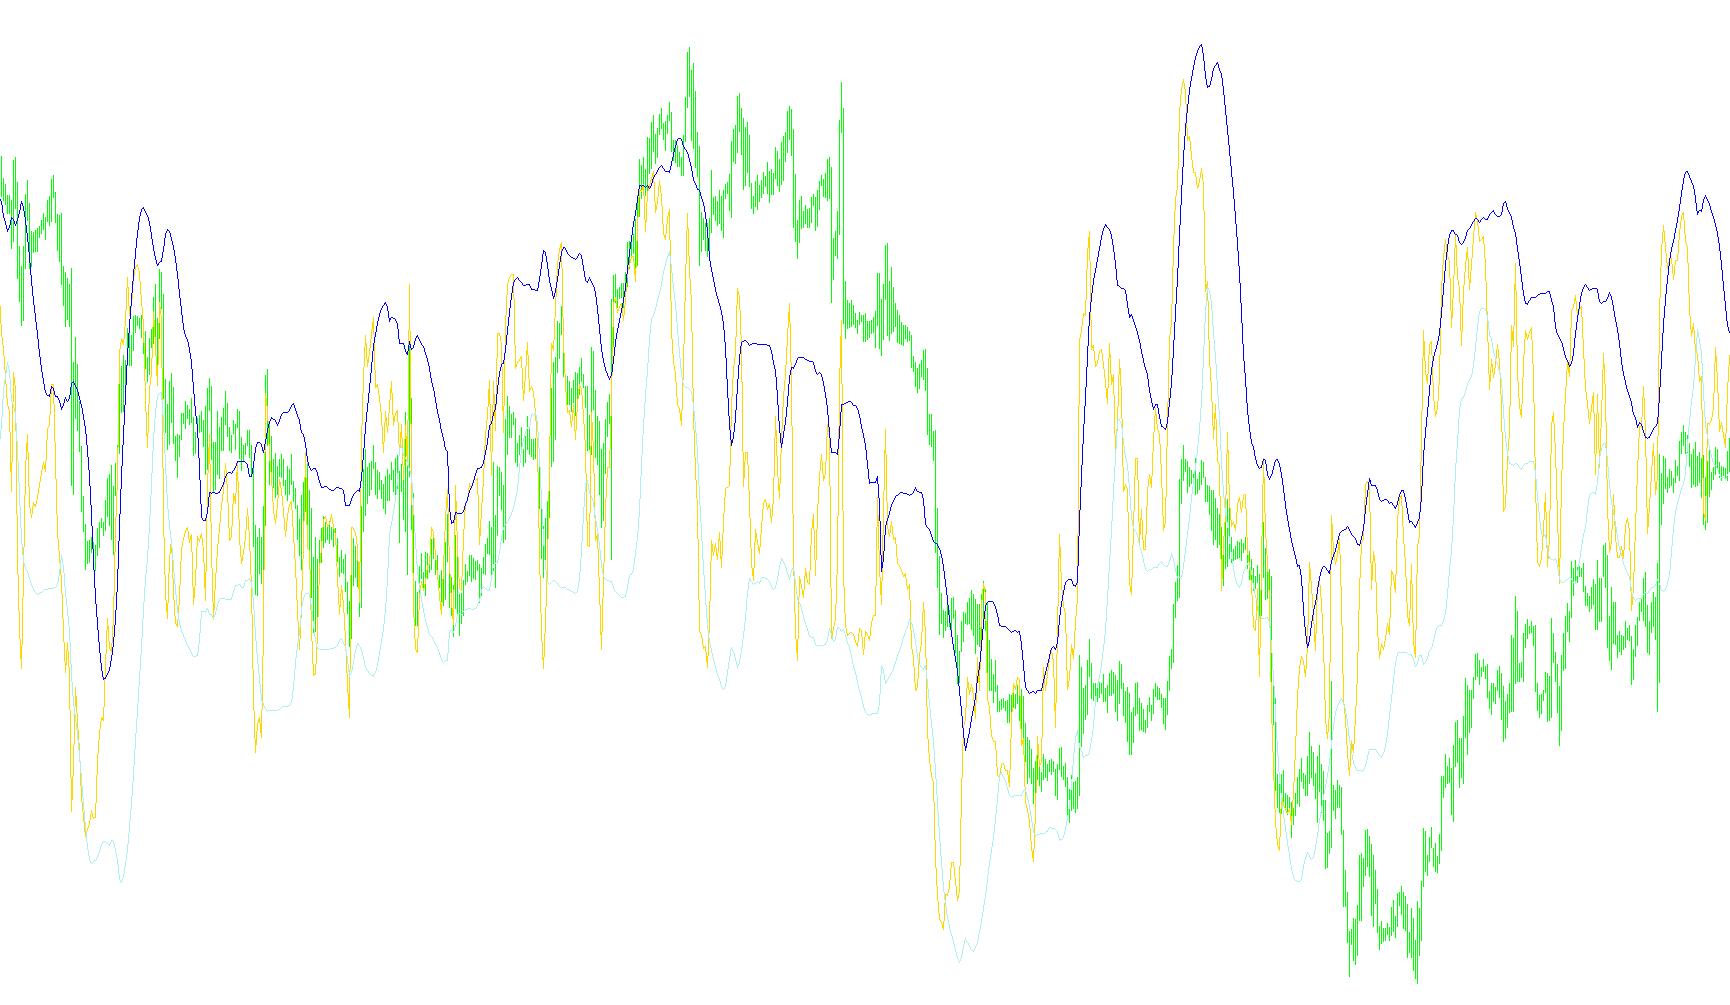
This custom indicator is designed to provide traders with a visual tool for identifying overbought and oversold conditions by applying a dynamic "envelope" or "channel" to the Relative Strength Index (RSI). Instead of relying on static, fixed levels—which can often be misleading as market volatility changes—this script adapts to current market behavior in real-time.
Core Logic and Functionality
The indicator operates through three primary layers of calculation:
1. The Base Momentum (RSI) At its foundation, the tool calculates the standard Relative Strength Index (RSI). This measures the speed and change of price movements, helping to determine whether an asset is being purchased or sold aggressively.
2. The Moving Average Overlay To smooth out the erratic "zig-zag" nature of the RSI, the script calculates a moving average of the RSI values over a specific period. This creates a central trend line that shows the general direction of the momentum.
3. Dynamic Zone Boundaries (Volatility Adjustment) This is the core unique feature of the tool. The script calculates the statistical "Standard Deviation" of the RSI data. It uses this math to build an upper and lower boundary around the moving average:
- Upper Zone: Represents a dynamically calculated ceiling based on the current volatility.
- Lower Zone: Represents a dynamically calculated floor based on the current volatility.
How to Interpret the Results
Because the boundaries expand and contract based on how much the market is swinging, they provide a more accurate "normal" range for price action.
- When the RSI line pushes outside of these dynamic zones, it suggests that the momentum is becoming extreme relative to recent history.
- An exit above the upper zone may indicate an overextended upward move, while a drop below the lower zone may signal an overextended downward move.
By using these moving boundaries rather than flat lines, the indicator helps traders distinguish between a healthy trend and a potential reversal point that is specific to the current market environment.
/*-----------------------------+
|			       |
| Shared by www.Aptrafx.com    |
|			       |
+------------------------------*/

//+------------------------------------------------------------------+
//|                                             Dynamic Zone RSI.mq4 |
//|                                   Copyright © 2005, Pavel Kulko. |
//|                                                  polk@alba.dp.ua |
//+------------------------------------------------------------------+
#property copyright "Copyright © 2005, Pavel Kulko"
#property link      "polk@alba.dp.ua"
#property indicator_buffers 3
#property indicator_color1 Lime
#property indicator_color2 SlateBlue
#property indicator_color3 Orange

#property indicator_separate_window

extern int RSIPeriod = 14;
extern int BandPeriod = 20;

double RSIBuf[],UpZone[],DnZone[];
//+------------------------------------------------------------------+
//| Custom indicator initialization function                         |
//+------------------------------------------------------------------+
int init()
  {
//---- indicators
   SetIndexStyle(0,DRAW_LINE);
   SetIndexStyle(1,DRAW_LINE);
   SetIndexStyle(2,DRAW_LINE);
   SetIndexBuffer(0,RSIBuf);
   SetIndexBuffer(1,UpZone);
   SetIndexBuffer(2,DnZone);
//----
   return(0);
  }
//+------------------------------------------------------------------+
//| Custor indicator deinitialization function                       |
//+------------------------------------------------------------------+
int deinit()
  {
//----

//----
   return(0);
  }
//+------------------------------------------------------------------+
//| Custom indicator iteration function                              |
//+------------------------------------------------------------------+
int start()
  {
   double MA, RSI[];
   ArrayResize(RSI,BandPeriod);
   int counted_bars=IndicatorCounted();
   int limit = Bars-counted_bars-1;
   for(int i=limit; i>=0; i--)
   {
      RSIBuf[i] = iRSI(NULL,0,RSIPeriod,PRICE_WEIGHTED,i);
      MA = 0;
      for(int j=i; j<i+BandPeriod; j++) {
         RSI[j-i] = RSIBuf[j];
         MA += RSIBuf[j]/BandPeriod;
      }
      UpZone[i] = MA + (1.3185 * StDev(RSI,BandPeriod));
      DnZone[i] = MA - (1.3185 * StDev(RSI,BandPeriod));
   }

//----
   return(0);
  }

double StDev(double& Data[], int Per)
{
  return(MathSqrt(Variance(Data,Per)));
}

double Variance(double& Data[], int Per)
{
  double sum, ssum;
  for (int i=0; i<Per; i++)
  {
    sum += Data[i];
    ssum += MathPow(Data[i],2);
  }
  return((ssum*Per - sum*sum)/(Per*(Per-1)));
}
//+------------------------------------------------------------------+
Comments