DUR
Download script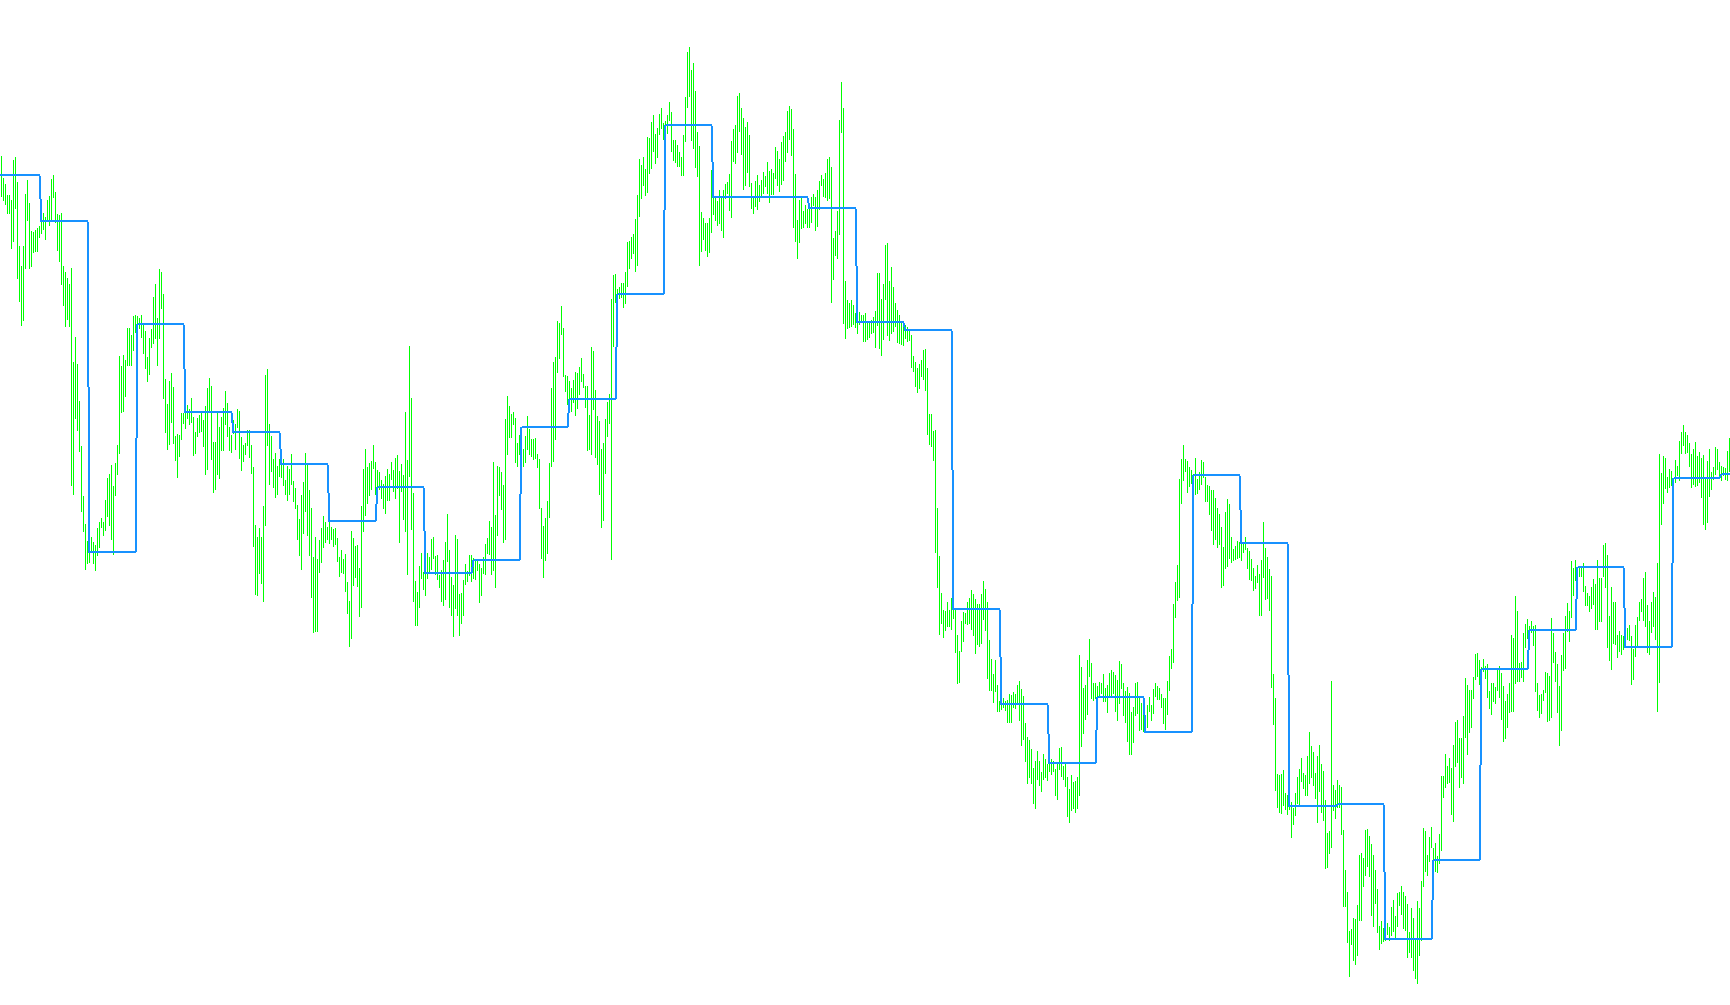
This tool is designed to provide traders with automated technical analysis by identifying key price levels, known as Pivot Points, directly on a trading chart. Instead of requiring you to calculate these mathematical values manually, the script processes historical and real-time data to project specific boundaries where the market might experience resistance or support.
How the Logic Works
The script functions by observing the movement of the market over a specific timeframe (typically a day). It tracks the "High," "Low," "Close," and "Open" prices to calculate various levels of significance:
- Core Pivot Points: The script calculates primary balance points (Pivot 1, 2, 3, and 4) based on different mathematical averages of the preceding price action.
- Support and Resistance: Beyond just identifying a center point, the logic projects "Support" levels (where prices may struggle to fall further) and "Resistance" levels (where prices may struggle to rise further).
- Dynamic Tracking: The tool is programmed to recognize when a new trading day begins. At this specific transition, it captures the final data from the previous period to generate the new set of levels for the current session.
Customizable Features
The script is highly flexible, allowing you to toggle specific types of calculations on or off based on your personal trading style:
- Calculation Methods: You can choose between different formulas for calculating the various pivot levels (e.g., whether to include the opening price in the average).
- Visibility Toggles: Not all traders need every line on their screen. The logic allows you to activate or deactivate specific components, such as the Daily Open price or high-intensity Support and Resistance levels (Sup/Res 3 and 4), ensuring your chart remains clean and focused on your preferred data.
Summary for the User
Essentially, this script acts as an automated "map" for the market. By analyzing where the price was yesterday, it predicts potential turning points for today. This helps you visualize where significant "walls" (Resistance) and "floors" (Support) might exist, allowing for more informed entry and exit decisions.
//+------------------------------------------------------------------+
//|                                                            PIVOT |
//|                                                            Darma |
//|                                              http://darmasdt.com |
//+------------------------------------------------------------------+
#property copyright "Darma"
#property link      "http://groups.yahoo.com/group/indotraders"

#property indicator_chart_window
#property indicator_buffers 8
#property indicator_color1 Red
#property indicator_color2 Goldenrod
#property indicator_color3 Blue
#property indicator_color4 Black
#property indicator_color5 Green
#property indicator_color6 Green
#property indicator_color7 Green
#property indicator_color8 Green
//---- input parameters
extern int change_day_hour=0;
extern bool HLCCper4=false;
extern bool HLCper3=false;
extern bool HLper2=false;
extern bool DailyOpen=true;
extern bool Sup_Res4=false;
extern bool Sup_Res3=false;
//---- buffers
double Pivot4[];
double Pivot3[];
double Pivot2[];
double Pivot1[];
double Res4[];
double Sup4[];
double Res3[];
double Sup3[];
//---- variables
int limit, cur_day, prev_day, barChangeDay;
double y_c,t_o,y_h,y_l,P4,P3,P2,R4,S4,R3,S3;
double day_high, day_low, dayHprev, dayLprev;

//+------------------------------------------------------------------+
//| Custom indicator initialization function                         |
//+------------------------------------------------------------------+
int init()
  {
//---- indicators
   SetIndexStyle(0,DRAW_LINE,STYLE_DASHDOTDOT,1);
   SetIndexBuffer(0,Pivot4);
   SetIndexStyle(1,DRAW_LINE,STYLE_DASHDOTDOT,1);
   SetIndexBuffer(1,Pivot3);
   SetIndexStyle(2,DRAW_LINE,STYLE_DASHDOTDOT,1);
   SetIndexBuffer(2,Pivot2);
   SetIndexStyle(3,DRAW_LINE,STYLE_SOLID,2);
   SetIndexBuffer(3,Pivot1);
   SetIndexStyle(4,DRAW_LINE,STYLE_DASHDOTDOT,1);
   SetIndexBuffer(4,Res4);
   SetIndexStyle(5,DRAW_LINE,STYLE_DASHDOTDOT,1);
   SetIndexBuffer(5,Sup4);
   SetIndexStyle(6,DRAW_LINE,STYLE_DASHDOTDOT,1);
   SetIndexBuffer(6,Res3);
   SetIndexStyle(7,DRAW_LINE,STYLE_DASHDOTDOT,1);
   SetIndexBuffer(7,Sup3);
//----
   return(0);
  }
//+------------------------------------------------------------------+
//| Custom indicator deinitialization function                       |
//+------------------------------------------------------------------+
int deinit()
  {
//---- TODO: add your code here
   ObjectsRedraw();
//----
   return(0);
  }
//+------------------------------------------------------------------+
//| Custom indicator iteration function                              |
//+------------------------------------------------------------------+
int start()
  {
   int counted_bars=IndicatorCounted();
   if (counted_bars<0) return(-1);
   if (counted_bars>0) counted_bars--;

   limit=Bars-counted_bars;
//----
   for(int i=limit; i>=0; i--)
     {
      cur_day=TimeDay(Time[i]);
      if  (
          TimeHour(Time[i])==change_day_hour &&
          TimeMinute(Time[i])==0
          )
        {
         barChangeDay=i;
         y_c=Close[i+1];
         t_o=Open[i];
         y_h=day_high;
         y_l=day_low;
         P4=(y_h + y_l + y_c + t_o)/4;
         P3=(y_h + y_l + y_c)/3;
         P2=(y_h + y_l)/2;
         R4=P4 + (P4 - y_l);
         R3=P3 + (P3 - y_l);
         S4=P4 + (P4 - y_h);
         S3=P3 + (P3 - y_h);
         day_high=High[i];
         day_low =Low[i];
        } // if
      dayHprev=day_high;
      dayLprev=day_low;
      day_high=MathMax(day_high, High[i]);
      day_low=MathMin(day_low, Low[i]);
      if (HLCCper4)
        {
         Pivot4[i]=P4;
        }
      if (HLCper3)
        {
         Pivot3[i]=P3;
        }
      if (HLper2)
        {
         Pivot2[i]=P2;
        }
      if (DailyOpen)
        {
         Pivot1[i]=t_o;
        }
      if (Sup_Res4)
        {
         Res4[i]=R4;
         Sup4[i]=S4;
        }
      if (Sup_Res3)
        {
         Res3[i]=R3;
         Sup3[i]=S3;
        }
     } // for
//---- done
   return(0);
  }
//+------------------------------------------------------------------+
Comments