DT-RSI-Sig_v4
Download script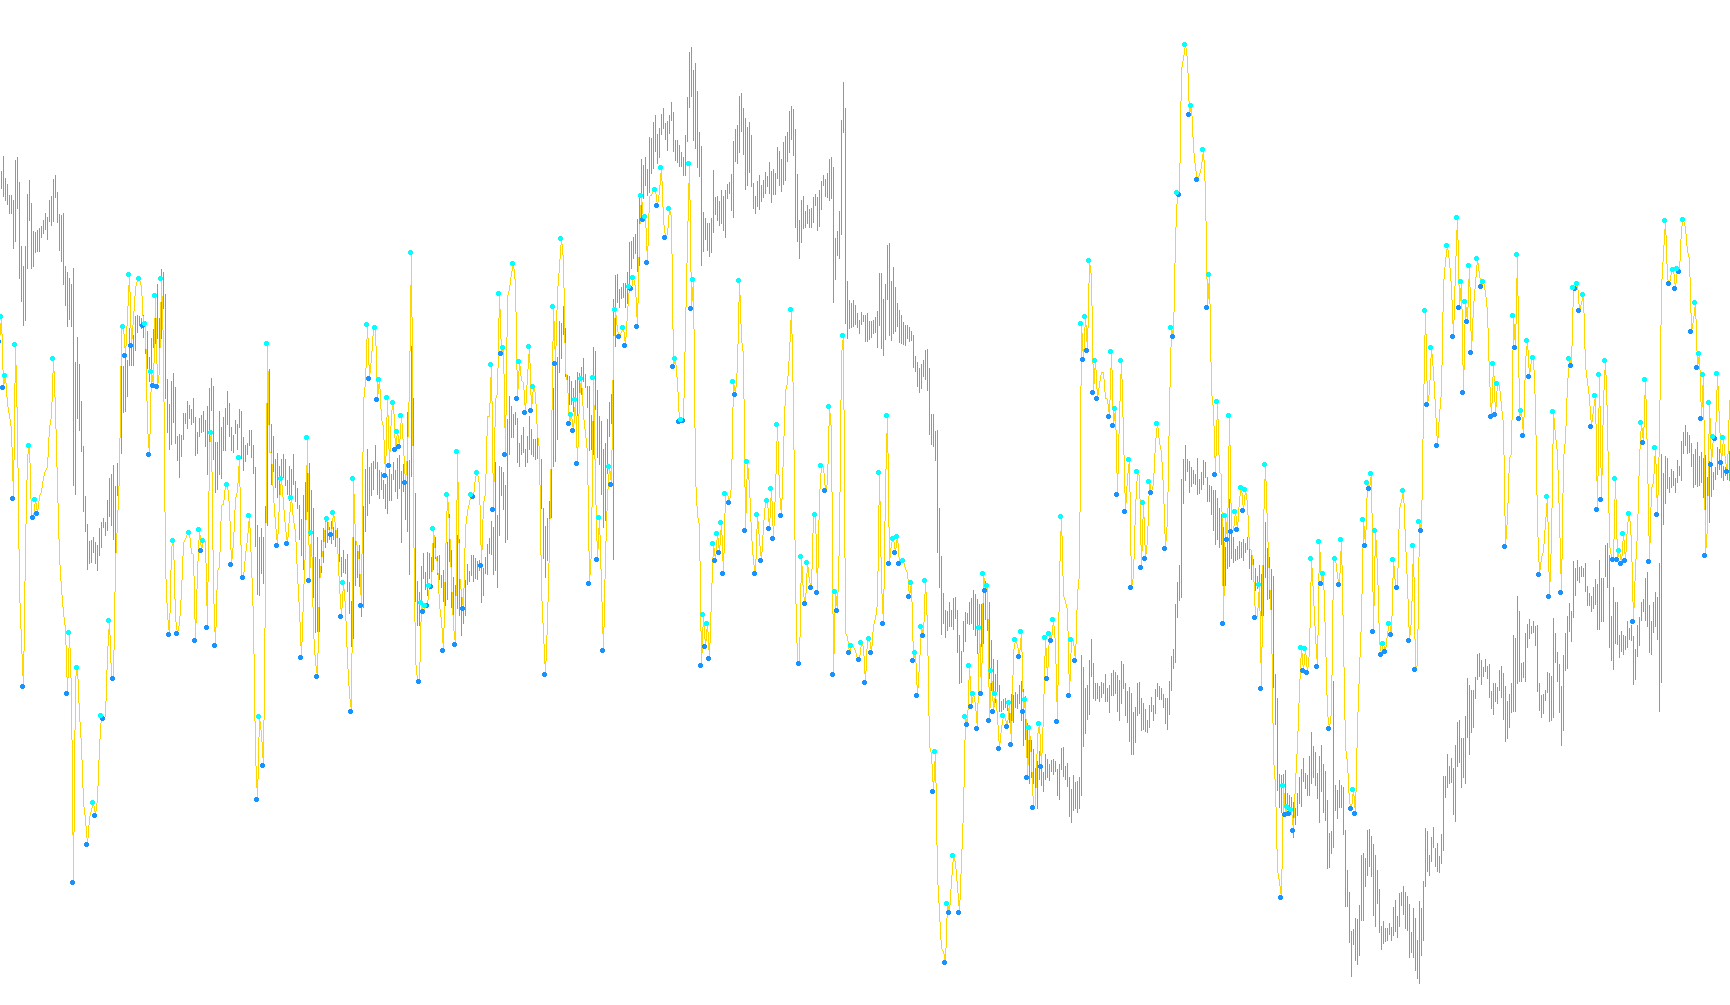
This technical indicator is designed to analyze price momentum by tracking the behavior of the Relative Strength Index (RSI). Rather than simply providing a standard RSI line, this script interprets the "peaks" and "troughs" of market movement to identify trend reversals and generate specific entry signals.
Core Logic and Movement Tracking
The script continuously monitors the RSI values to detect changes in direction:
- Peak Detection: It identifies points where the RSI reaches a local high and begins to turn downward.
- Trough Detection: It identifies points where the RSI reaches a local low and begins to turn upward.
Once these turning points are identified, the script applies specific filters to ensure the signals are meaningful. For instance, it looks for significant price action (peaks above certain thresholds or troughs below others). If the market movement is too weak or does not meet these criteria, the script ignores those points to avoid "noisy" or insignificant data.
Trend Identification and Visualization
To provide a clear visual guide for traders, the script dynamically draws trend lines on the chart:
- Buy Trends (Blue): When a significant upward turnaround is confirmed, the script draws a blue trend line connecting the identified high points.
- Sell Trends (Red): When a significant downward turnaround is confirmed, the script draws a red trend line connecting the identified low points.
These lines act as a visual representation of the current market momentum, helping the user see the "path" the price action is taking.
Entry Signal Generation
The primary goal of this script is to provide actionable Buy and Sell signals based on the relationship between the current RSI and the trend lines it creates:
- Sell Signals: A sell signal is triggered when the RSI moves above the midpoint (50) but then crosses back below a specific calculated point on a downward-trending line. This suggests that while there was a moment of strength, the overall momentum is still moving lower.
- Buy Signals: A buy signal is triggered when the RSI stays above 40 and dips below the midpoint (50), but then recovers by crossing back above a specific point on an upward-trending line. This suggests a "pullback" in an overall bullish trend.
Summary for the User
In simple terms, this script filters out the everyday fluctuations of the market to find significant structural turning points. It paints these turns as clear blue or red trend lines and provides specific alerts when the price momentum "bounces" off those trends, attempting to capture entries where the trend is established but the price is temporarily adjusting.
//+------------------------------------------------------------------+
//|                                                   DT-RSI-Sig.mq4 |
//+------------------------------------------------------------------+
#property copyright "klot"
#property link      "klot@mail.ru"
//----
#property indicator_separate_window
#property indicator_minimum 20
#property indicator_maximum 80
#property indicator_buffers 5
#property indicator_color1 Aqua
#property indicator_color2 Red
#property indicator_color3 Blue
#property indicator_color4 Red
#property indicator_color5 Blue
//---- input parameters
extern int       PeriodRSI=14;
//---- buffers
double ExtMapBuffer1[];
double ExtMapBuffer2[];
double ExtMapBuffer3[];
double ExtMapBuffer4[];
double ExtMapBuffer5[];
//+------------------------------------------------------------------+
//| Custom indicator initialization function                         |
//+------------------------------------------------------------------+
int init()
  {
//---- indicators
   SetIndexStyle(0,DRAW_LINE);
   SetIndexBuffer(0,ExtMapBuffer1);
   SetIndexStyle(1,DRAW_ARROW);
   SetIndexArrow(1,242);
   SetIndexBuffer(1,ExtMapBuffer2);
   SetIndexEmptyValue(1,0.0);
   SetIndexStyle(2,DRAW_ARROW);
   SetIndexArrow(2,241);
   SetIndexBuffer(2,ExtMapBuffer3);
   SetIndexEmptyValue(2,0.0);
   SetIndexStyle(3,DRAW_ARROW);
   SetIndexArrow(3,159);
   SetIndexBuffer(3,ExtMapBuffer4);
   SetIndexEmptyValue(3,0.0);
   SetIndexStyle(4,DRAW_ARROW);
   SetIndexArrow(4,159);
   SetIndexBuffer(4,ExtMapBuffer5);
   SetIndexEmptyValue(4,0.0);
//----
   return(0);
  }
//+------------------------------------------------------------------+
//| Custor indicator deinitialization function                       |
//+------------------------------------------------------------------+
int deinit()
  {
//----
   ObjectsDeleteAll(1, OBJ_TREND);
   ObjectsRedraw();
//----
   return(0);
  }
//+------------------------------------------------------------------+
//| Custom indicator iteration function                              |
//+------------------------------------------------------------------+
int start()
  {
   int    k,limit,pos1,pos2,pos3,pos4;
   int    counted_bars=IndicatorCounted();
   double rsi1,rsi2,rsi3,vol1,vol2,vol3,vol4;
//----
   if (counted_bars<0) return(-1);
   if (counted_bars>0) counted_bars--;
//----
   limit=Bars-counted_bars;
//----
   for(int i=0; i<limit; i++)
     {
      ExtMapBuffer1[i]=iRSI(NULL,0,PeriodRSI,PRICE_CLOSE,i);
//----
      rsi1=iRSI(NULL,0,PeriodRSI,PRICE_CLOSE,i+1);
      rsi2=iRSI(NULL,0,PeriodRSI,PRICE_CLOSE,i+2);
      rsi3=iRSI(NULL,0,PeriodRSI,PRICE_CLOSE,i+3);
//----
      if  (rsi1<rsi2 && rsi2>rsi3) ExtMapBuffer5[i+2]=rsi2; //Âåðõóøêà. RSI ïîâîðà÷èâàåò âíèç
      if  (rsi1>rsi2 && rsi2<rsi3) ExtMapBuffer4[i+2]=rsi2; //Äîíûøêî. RSI ïîâîðà÷èâàåò ââåðõ
     }
//------ Ïîèñê âåðõóøåê ------
   k=0;
   for(i=0; i<500; i++)
     {
      if (ExtMapBuffer5[i]>40 && k==0) { vol1=ExtMapBuffer5[i]; pos1=i; k++;}
      if (ExtMapBuffer5[i]>60 && ExtMapBuffer5[i]>vol1 && k!=0) { vol2=ExtMapBuffer5[i]; pos2=i; k++;}
      if (k>1) break;
     }
   // Åñëè åñòü ìèíèìóì íèæå 40, òî ëèíèþ òðåíäà íå ñòðîèì, ò.ê. ñ÷èòàåì ÷òî íàïðàâëåíèå òðåíäà èçìåíèëîñü
   for(i=0; i<pos2; i++)
     {
      if(ExtMapBuffer4[i]!=0 && ExtMapBuffer4[i]<40) {vol1=0; vol2=0;}
     }
//----- Ïîèñê äîíûøåê ------
   k=0;
   for(i=0; i<500; i++)
     {
      if (ExtMapBuffer4[i]<60 && ExtMapBuffer4[i]!=0 && k==0) { vol3=ExtMapBuffer4[i]; pos3=i; k++;}
      if (ExtMapBuffer4[i]!=0 && ExtMapBuffer4[i]<40 && ExtMapBuffer4[i]<vol3 && k!=0) { vol4=ExtMapBuffer4[i]; pos4=i; k++;}
      if (k>1) break;
     }
   // Åñëè åñòü ìàêñèìóì áîëüøå 60, òîãäà ëèíèþ òðåíäà íå ñòðîèì, ò.ê. ñ÷èòàåì ÷òî íàïðàâëåíèå òðåíäà èçìåíèëîñü
   for(i=0; i<pos4; i++)
     {
      if(ExtMapBuffer5[i]!=0 && ExtMapBuffer5[i]>60) {vol3=0; vol4=0;}
     }
   // ---- Ñèãíàëû äëÿ âõîäîâ Buy è Sell
   rsi1=iRSI(NULL,0,PeriodRSI,PRICE_CLOSE,1);
   rsi2=iRSI(NULL,0,PeriodRSI,PRICE_CLOSE,2);
//------------
   double volDW,volDW1,volDW2,volUP,volUP1,volUP2;
   if (vol3!=0 && vol4!=0)
     {
      volDW=vol3+((pos3)*(vol3-vol4)/(pos4-pos3));
      volDW1=vol3+((pos3-1)*(vol3-vol4)/(pos4-pos3));
      volDW2=vol3+((pos3-2)*(vol3-vol4)/(pos4-pos3));
     }
   if (volDW!=0 && rsi2>50 && rsi1<volDW1 && rsi2>volDW2)ExtMapBuffer2[0]=volDW; // Ñèãíàë Sell
//------------
//------------
   if (vol1!=0 && vol2!=0)
     {
      volUP=vol1+(pos1*(vol1-vol2)/(pos2-pos1));
      volUP1=vol1+((pos1-1)*(vol1-vol2)/(pos2-pos1));
      volUP2=vol1+((pos1-2)*(vol1-vol2)/(pos2-pos1));
     }
   if (volUP!=0 && rsi2<50 && rsi2>40 && rsi1>volUP1 && rsi2<volUP2)ExtMapBuffer3[0]=volUP; // Ñèãíàë Buy
//------------
   ObjectsDeleteAll(1, OBJ_TREND);
   ObjectsRedraw();
   if (vol3!=0 && vol4!=0 )
     {
      ObjectCreate("Sell",OBJ_TREND,1,Time[pos4],vol4,Time[pos3],vol3);
      ObjectSet("Sell",OBJPROP_COLOR,Red);
      ObjectSet("Sell",OBJPROP_WIDTH,2);
      ObjectSet("Sell",OBJPROP_STYLE,STYLE_SOLID);
     }
   if (vol1!=0 && vol2!=0)
     {
      ObjectCreate("Buy",OBJ_TREND,1,Time[pos2],vol2,Time[pos1],vol1);
      ObjectSet("Buy",OBJPROP_COLOR,Blue);
      ObjectSet("Buy",OBJPROP_WIDTH,2);
      ObjectSet("Buy",OBJPROP_STYLE,STYLE_SOLID);
     }

//----
   return(0);
  }
//+------------------------------------------------------------------+
Comments