Daily_High_Low
Download script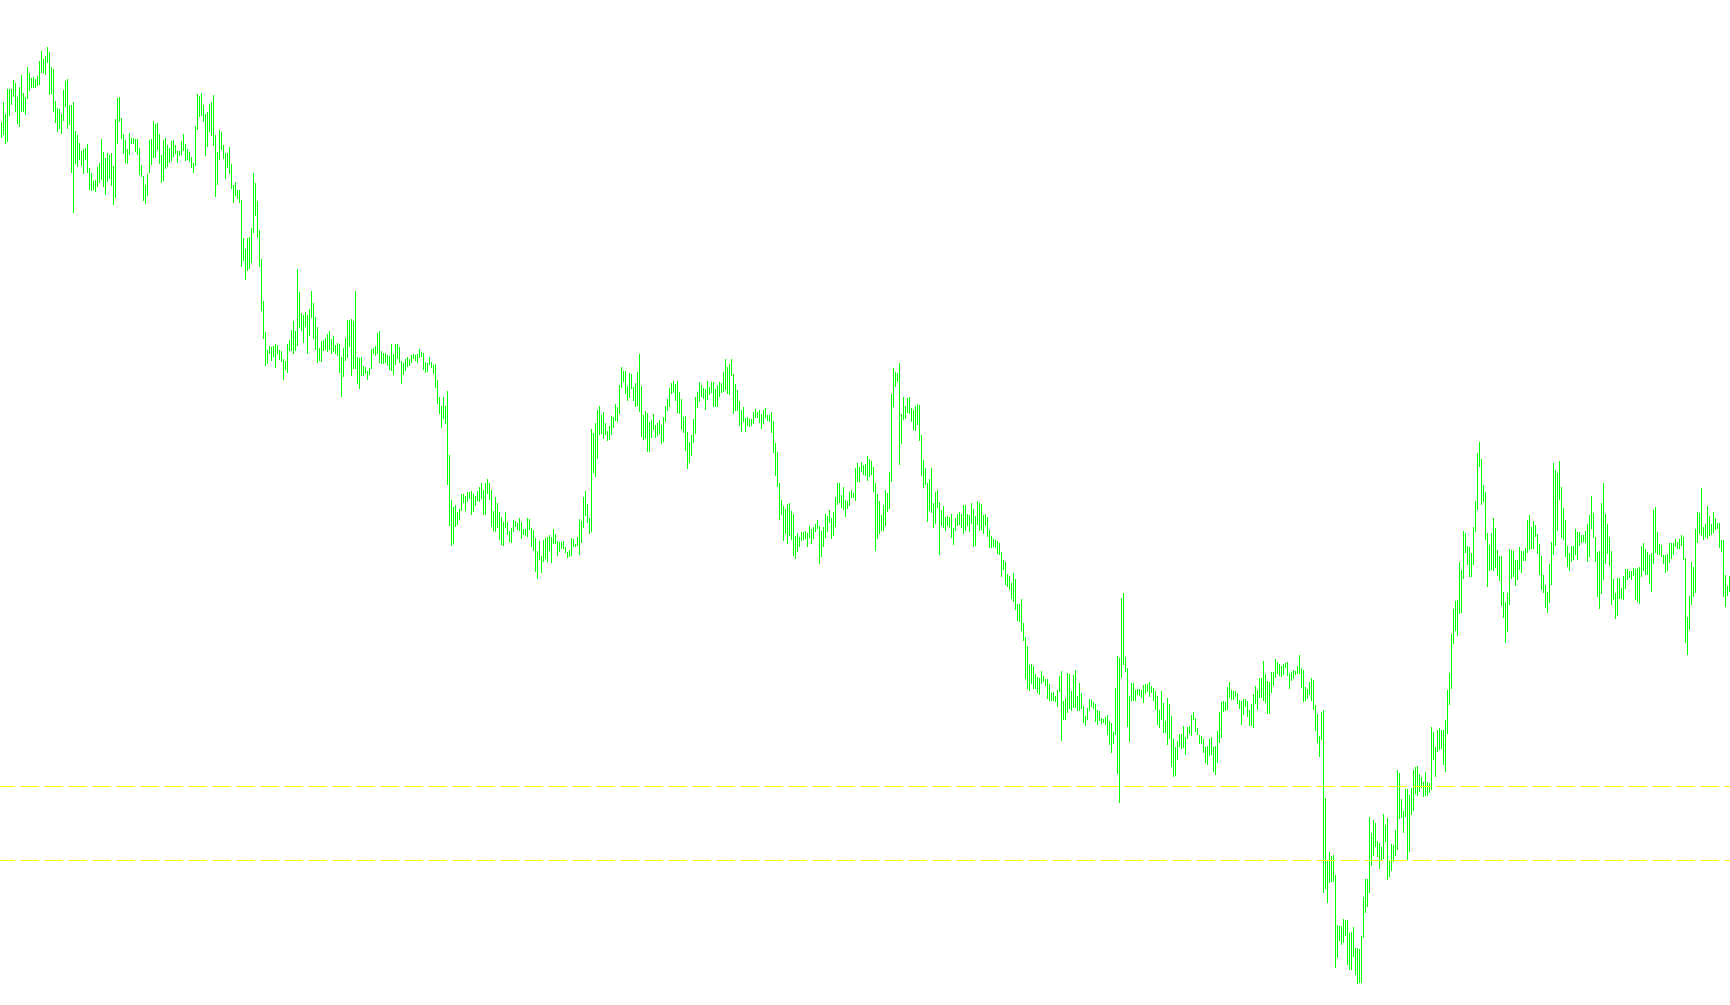
This tool is designed to provide traders with a clear, visual reference of the previous day's price action on their trading charts. By automatically identifying and plotting key price levels from the prior 24-hour period, it helps users quickly see where the market peaked and bottomed out yesterday.
Core Functionality
The script works by analyzing daily historical data to pinpoint two specific figures: the Daily High and the Daily Low from the completed trading day before today. Instead of requiring the user to manually look up these prices in a history tab, the tool performs this calculation automatically and projects these levels onto the current chart.
Visual Representation
To make this information easily accessible, the script handles three main visual components:
- Horizontal Reference Lines: It draws two dashed horizontal lines across the chart. These lines extend to show exactly where yesterday’s highest price point and lowest price point were reached.
- Dynamic Labeling: The tool places text labels directly on the chart (near the current price area) to identify these levels clearly as "Y/days High" and "Y/days Low."
- Real-Time Updates: As new market data arrives, the script ensures that these lines stay anchored to the correct historical prices, moving or updating automatically so they always reflect the most recent completed day.
Practical Use for Traders
This logic is primarily used by traders who rely on "Support and Resistance" levels. By seeing yesterday's high and low clearly marked:
- Identify Breakouts: Traders can see if the current price is moving above or below yesterday's boundaries.
- Find Rejection Zones: It highlights areas where the price might struggle to move past, as these were significant turning points in previous trading activity.
- Enhanced Clarity: It cleans up the visual workspace by providing instant context without the need for manual calculation or constant switching between different timeframes.
//+------------------------------------------------------------------+
//|                                               Daily_High_Low.mq4 |
//|                                       Copyright © Terry Nicholls |
//+------------------------------------------------------------------+
#property copyright "Copyright © Terry Nicholls"

// Parameters

#property indicator_chart_window

extern int TimeZoneOfData = 0; // GMT

double yesterday_high=0;
double yesterday_low=0;

double rates_d1[2][6];
double dlyh;
double dlyl;

//+------------------------------------------------------------------+
//| Custom indicator initialization function                         |
//+------------------------------------------------------------------+

int init()
  {

// Indicators

dlyh=0; dlyl=0;

   return(0);
  }

//+------------------------------------------------------------------+
//| Custom indicator deinitialization function                       |
//+------------------------------------------------------------------+

int deinit()
  {

ObjectDelete("dlyh Label");
ObjectDelete("dlyh Line");
ObjectDelete("dlyl Label");
ObjectDelete("dlyl Line");

   return(0);
  }

//+------------------------------------------------------------------+
//| Custom indicator iteration function                              |
//+------------------------------------------------------------------+

int start()
  {

// Get new Daily prices

ArrayCopyRates(rates_d1, Symbol(), PERIOD_D1);

yesterday_high = rates_d1[1][3];
yesterday_low = rates_d1[1][2];

// Calculate Daily High/Low lines

dlyh = yesterday_high;
dlyl = yesterday_low;

// Uncomment the line below to display the data at the top of your chart

// Comment ("Yesterday's High = ",yesterday_high,"  Yesterday's Low = ",yesterday_low);

// Set Daily High/Low line labels on chart window

      if(ObjectFind("dlyh label") != 0)
      {
      ObjectCreate("dlyh label", OBJ_TEXT, 0, Time[20], dlyh);
      ObjectSetText("dlyh label", "Y/days High", 10, "Arial", Yellow);
      }
      else
      {
      ObjectMove("dlyh label", 0, Time[20], dlyh);
      }

      if(ObjectFind("dlyl label") != 0)
      {
      ObjectCreate("dlyl label", OBJ_TEXT, 0, Time[20], dlyl);
      ObjectSetText("dlyl label", "Y/days Low", 10, "Arial", Yellow);
      }
      else
      {
      ObjectMove("dlyl label", 0, Time[20], dlyl);
      }

// Draw Yesterday's High/Low lines on chart

      if(ObjectFind("dlyh line") != 0)
      {
      ObjectCreate("dlyh line", OBJ_HLINE, 0, Time[40], dlyh);
      ObjectSet("dlyh line", OBJPROP_STYLE, STYLE_DASH);
      ObjectSet("dlyh line", OBJPROP_WIDTH,0 );
      ObjectSet("dlyh line", OBJPROP_COLOR, Yellow);
      //Alert("Daily Low" ,Symbol()," ",Period()," @ ",Bid);PlaySound("sound7.wav");
      }
      else
      {
      ObjectMove("dlyh line", 0, Time[40], dlyh);
      }

      if(ObjectFind("dlyl line") != 0)
      {
      ObjectCreate("dlyl line", OBJ_HLINE, 0, Time[40], dlyl);
      ObjectSet("dlyl line", OBJPROP_STYLE, STYLE_DASH);
      ObjectSet("dlyl line", OBJPROP_WIDTH, 0);
      ObjectSet("dlyl line", OBJPROP_COLOR, Yellow);
      //Alert("Daily High" ,Symbol()," ",Period()," @ ",Bid);PlaySound("sound7.wav");
      }
      else
      {
      ObjectMove("dlyl line", 0, Time[40], dlyl);
      }

   return(0); // End program

  }

//+------------------------------------------------------------------+
Comments