Damiani_volatmeterNoInputs
Download script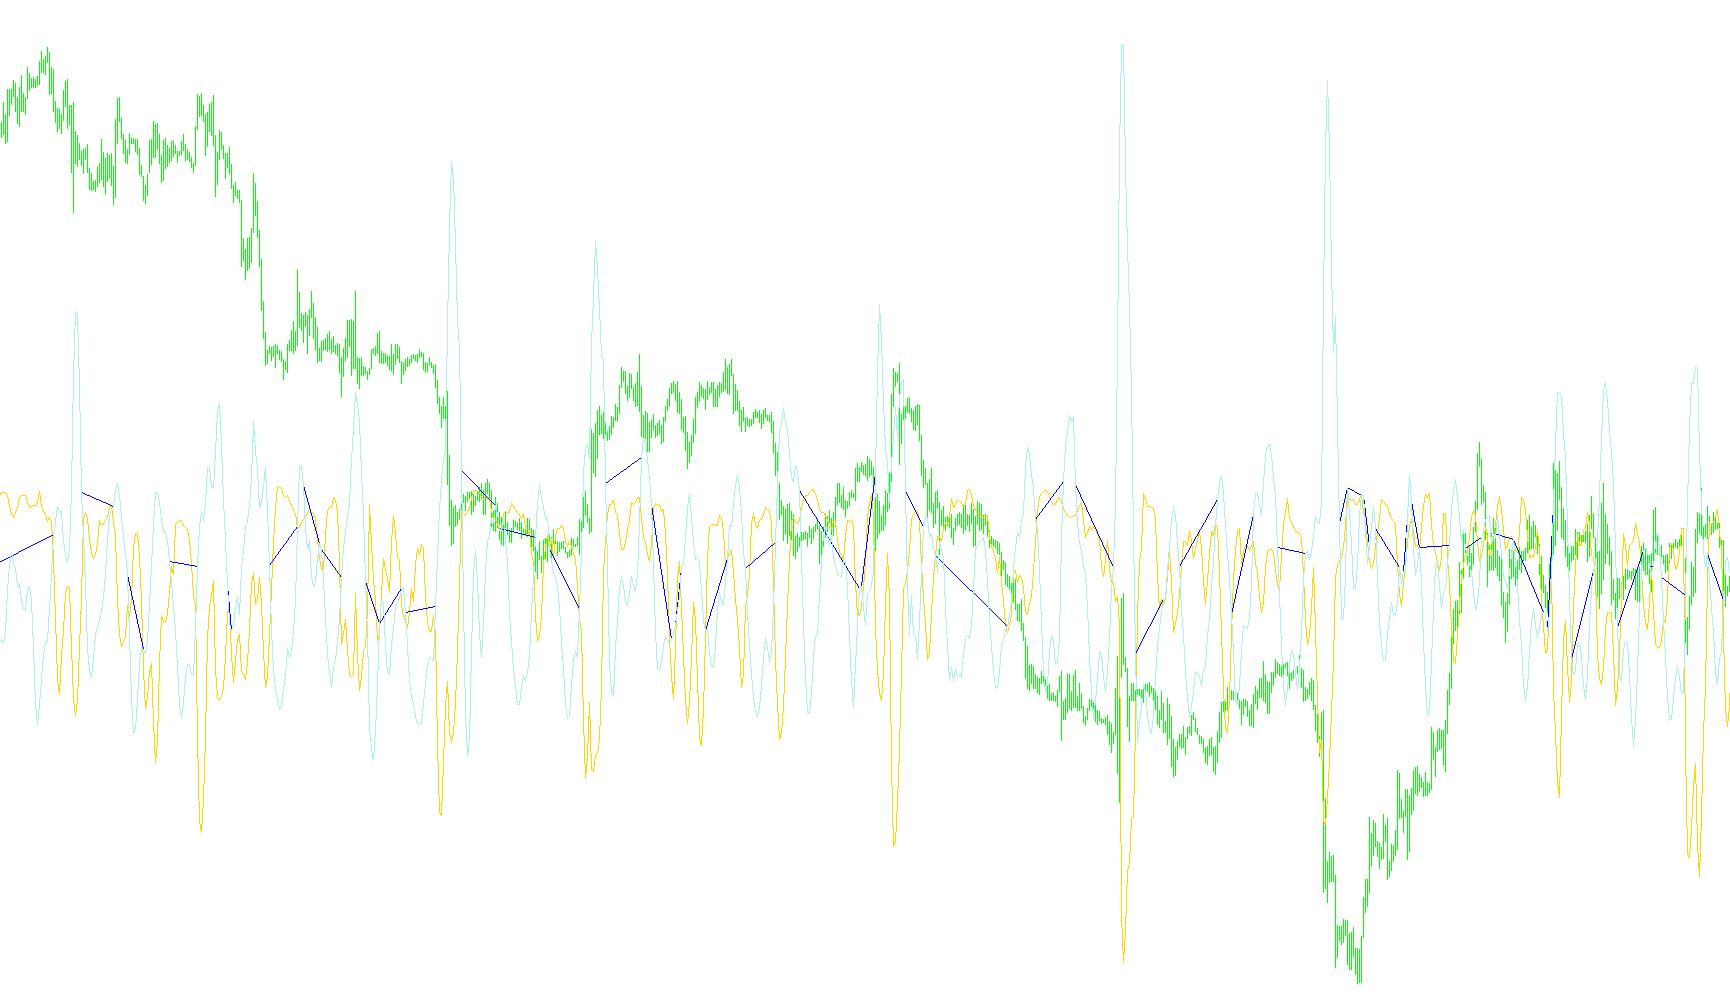
The Damiani Volatmeter is a technical analysis tool designed to help traders distinguish between meaningful market price movement and insignificant "noise." It acts as a filter, attempting to identify periods where volatility is high enough to be considered a tradable signal rather than just minor fluctuations in the market.
Core Logic and Mechanism
The tool operates by comparing two different perspectives of market volatility simultaneously: short-term behavior and long-term stability. Here is how it processes that data:
1. Measuring Relative Volatility The script calculates the "Average True Range" (ATR)—a standard measure of price movement—over two different time horizons: a "Viscosity" period (short-term) and a "Sedimentation" period (long-term). By dividing the short-term movement by the long-term movement, the tool creates a ratio. This ratio tells you how much the price is currently moving relative to its usual historical average.
2. Smoothing and Lag Reduction To ensure the data is reliable and doesn't react too wildly to every tiny tick, the script includes a "lag suppressor." This mathematical adjustment helps align the current data with recent history, ensuring that the movements shown on your chart are smooth and reflective of actual trends rather than erratic jumps.
3. The Noise Filter (Standard Deviation) The tool also looks at the Standard Deviation (how much prices vary from their average) across both the short and long timeframes. It uses this to establish a dynamic "noise" level. This is crucial because what constitutes "high volatility" during a quiet market might be considered "normal behavior" during a major news event.
4. The Trading Signal (Threshold) The heart of the indicator is its final calculation: it subtracts the calculated noise level from a predefined threshold.
- Trade Signal: If the relative volatility exceeds this calculated limit, the tool identifies the movement as a significant "Signal." This suggests that the market is moving with enough strength to potentially warrant a trade.
- No Trade Zone: If the movement remains below this limit, it is categorized as "Noise." The tool essentially tells you that while the price is moving, it lacks the sufficient momentum or character required for a high-quality entry.
How to Read the Results
When you use this indicator, it provides a visual distinction on your chart:
- Active Signals: When the volatility is sufficient, the indicator highlights the data (often accompanied by a text notification in the chart window) indicating a "TRADE" status.
- Passive Zones: When price action is dull or lacks momentum, the indicator remains muted, signaling a "DO NOT trade" status to help you avoid getting caught in low-probability market movements.
//+------------------------------------------------------------------+
//|                                           Damiani_volatmeter.mq4 |
//|                         Copyright © 2006, Luis Guilherme Damiani |
//|                                      http://www.damianifx.com.br |
//+------------------------------------------------------------------+
#property copyright "Copyright © 2006, Luis Guilherme Damiani"
#property link      "http://www.damianifx.com.br"

#property indicator_separate_window
#property indicator_buffers 3
#property indicator_color1 Silver
#property indicator_color2 FireBrick
#property indicator_color3 Lime
//---- input parameters
 int       Viscosity=7;
 int       Sedimentation=40;
 double    Threshold_level=1.40;
 bool      lag_supressor=true;
double    lag_s_K=0.5;
//---- buffers
double thresholdBuffer[];
double vol_m[];
double vol_t[];
double ind_c[];
//+------------------------------------------------------------------+
//| Custom indicator initialization function                         |
//+------------------------------------------------------------------+
int init()
  {
//---- indicators
   SetIndexStyle(0,DRAW_LINE);
   SetIndexBuffer(0,thresholdBuffer);
   SetIndexStyle(1,DRAW_SECTION);
   SetIndexBuffer(1,vol_m);
   SetIndexStyle(2,DRAW_LINE);
   SetIndexBuffer(2,vol_t);

   ArrayResize(ind_c,Bars);
   ArrayInitialize(ind_c,0.0);
//----
   return(0);
  }
//+------------------------------------------------------------------+
//| Custor indicator deinitialization function                       |
//+------------------------------------------------------------------+
int deinit()
  {
//----

//----
   return(0);
  }
//+------------------------------------------------------------------+
//| Custom indicator iteration function                              |
//+------------------------------------------------------------------+
int start()
  {
   double vol=0;
   int    changed_bars=IndicatorCounted();
   //Comment("ATR ratio= "+short_atr+" / "+long_atr);
   int limit=Bars-changed_bars;
   if (limit>Sedimentation+5)limit=limit-Sedimentation;
   for(int i=limit;i>=0;i--)
   {

      double sa=iATR(NULL,0,Viscosity,i);
      double s1=ind_c[i+1];
      double s3=ind_c[i+3];
      double atr=NormalizeDouble(sa,Digits);
      if(lag_supressor)
         vol= sa/iATR(NULL,0,Sedimentation,i)+lag_s_K*(s1-s3);
      else
         vol= sa/iATR(NULL,0,Sedimentation,i);
      //vol_m[i]=vol;

      double anti_thres=iStdDev(NULL,0,Viscosity,0,MODE_LWMA,PRICE_TYPICAL,i);

      anti_thres=anti_thres/
                 iStdDev(NULL,0,Sedimentation,0,MODE_LWMA,PRICE_TYPICAL,i);

      double t=Threshold_level;
      t=t-anti_thres;

      if (vol>t){vol_t[i]=vol;vol_m[i]=vol;
                  IndicatorShortName("DAMIANI Signal/Noise: TRADE  /  ATR= "+DoubleToStr(atr,Digits)+"    values:");}
      else {vol_t[i]=vol;vol_m[i]=EMPTY_VALUE;
               IndicatorShortName("DAMIANI Signal/Noise: DO NOT trade  /  ATR= "+DoubleToStr(atr,Digits)+"    values:");}
      ind_c[i]=vol;
      thresholdBuffer[i]=t;
   }
//----

//----
   return(0);
  }
//+------------------------------------------------------------------+
Comments