Damiani_volatmeter_v2
Download script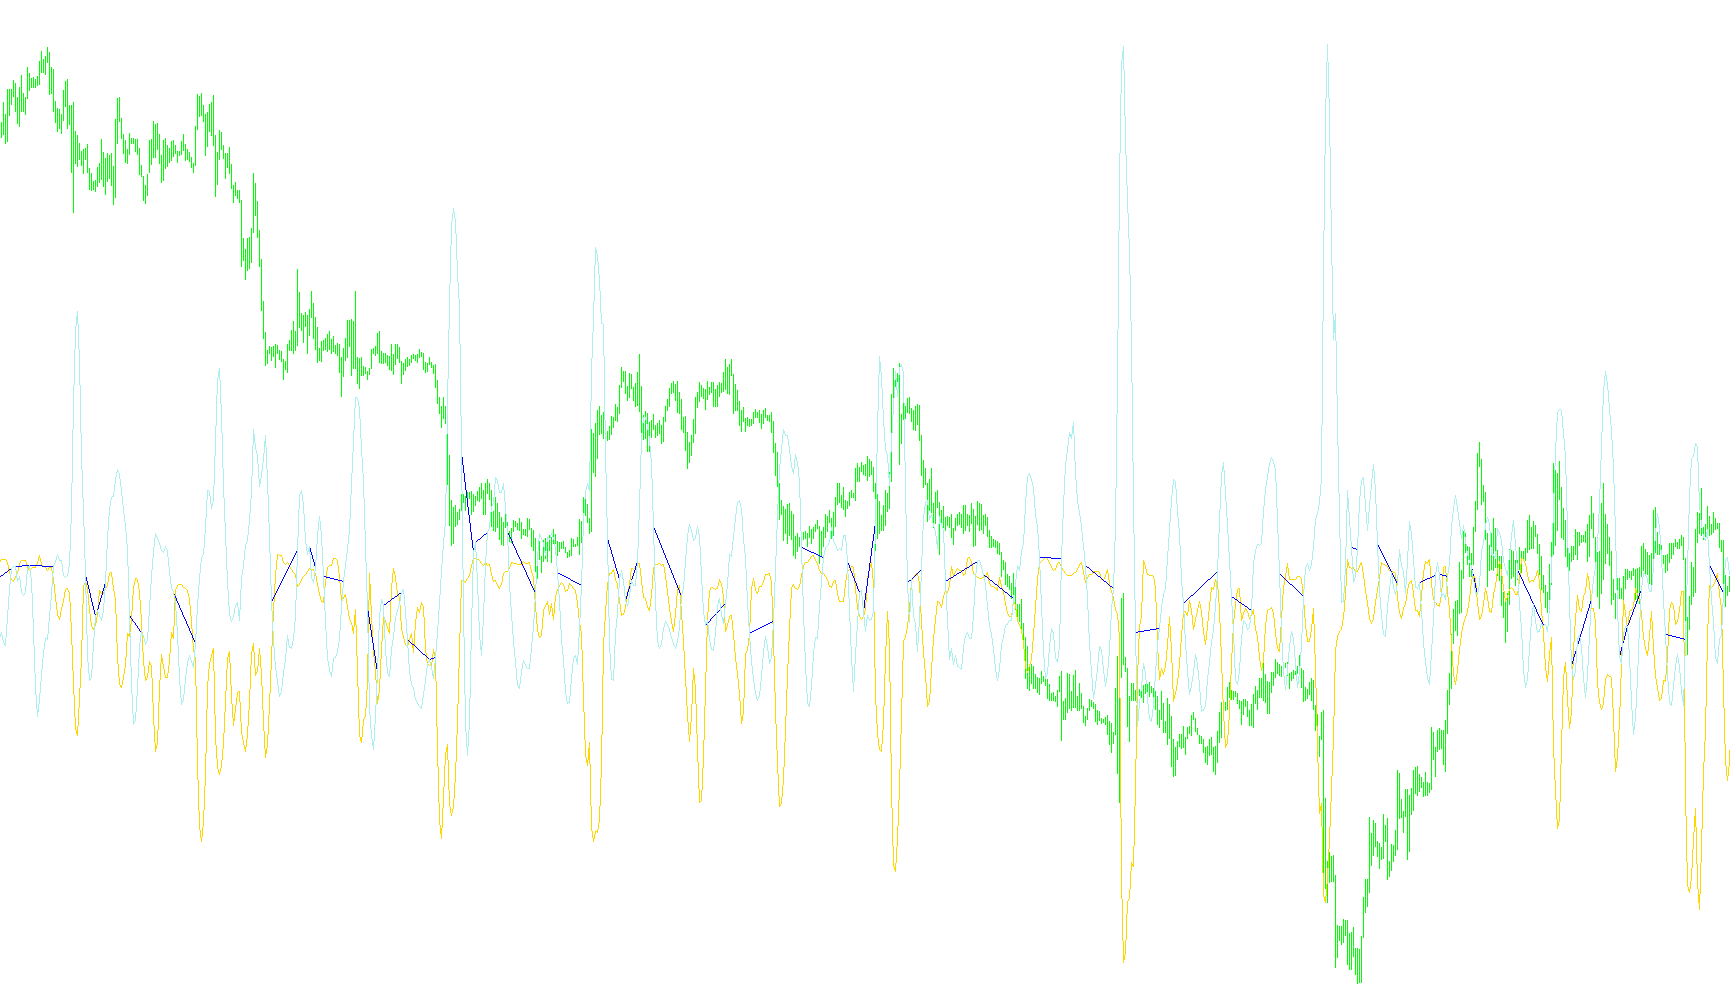
This technical tool, known as the Damiani Volatmeter, is designed to help traders distinguish between meaningful market movements and insignificant "noise." Its primary purpose is to evaluate market volatility and signal when price action is strong enough to warrant a potential trading opportunity.
How the Logic Works
The script operates by comparing two different types of market activity simultaneously: short-term fluctuations and long-term trends. To do this, it analyzes specific data points across three main categories:
1. Volatility Comparison The tool measures the "speed" and "size" of price movements over a short period (defined by the Viscosity setting) and compares it against a much larger historical timeframe (defined by the Sedimentation setting). By calculating the ratio between these two periods, the tool identifies whether the current market movement is an outlier or part of a standard rhythmic cycle.
2. Signal Smoothing To ensure that the data remains readable and doesn't jump erratically on your screen, the script includes a lag suppression mechanism. This logic calculates the difference between past values to smooth out the curves, providing a clearer view of the momentum without being distracted by momentary "glitches" in price action.
3. The Trade Threshold (Signal vs. Noise) The core intelligence of the script lies in its ability to establish a dynamic "Trade Threshold." Instead of using a static number, the tool calculates the standard deviation—a measure of how much price typically varies from its average.
By subtracting this standard deviation from a user-defined threshold level, the script creates a moving target. It then compares the current volatility ratio against this target:
- Trade Signal: If the current market activity exceeds the calculated threshold, the tool identifies the movement as significant "Signal," indicating higher potential for a trend.
- No Trade Zone: If the activity falls below this level, the script classifies the movement as "Noise," suggesting that the price action is too weak or disorganized to be reliable for trading.
Visual Output
The indicator provides real-time feedback in a separate window on your chart:
- It displays a visual representation of the volatility levels.
- It updates a status message on your screen, clearly labeling whether the current conditions are favorable for trading based on the Signal/Noise analysis.
- It highlights specific price sections where the volatility meets your requirements, allowing you to ignore periods of stagnant or deceptive market movement.
/*-----------------------------+
|			       |
| Shared by www.Aptrafx.com    |
|			       |
+------------------------------*/

//+------------------------------------------------------------------+
//|                                           Damiani_volatmeter.mq4 |
//|                         Copyright © 2006, Luis Guilherme Damiani |
//|                                      http://www.damianifx.com.br |
//+------------------------------------------------------------------+
#property copyright "Copyright © 2006, Luis Guilherme Damiani"
#property link      "http://www.damianifx.com.br"

#property indicator_separate_window
#property indicator_buffers 3
#property indicator_color1 Silver
#property indicator_color2 FireBrick
#property indicator_color3 Lime
//---- input parameters
extern int       Viscosity=7;
extern int       Sedimentation=50;
extern double    Threshold_level=1.1;
extern bool      lag_supressor=true;
double    lag_s_K=0.5;
//---- buffers
double thresholdBuffer[];
double vol_m[];
double vol_t[];
double ind_c[];
//+------------------------------------------------------------------+
//| Custom indicator initialization function                         |
//+------------------------------------------------------------------+
int init()
  {
//---- indicators
   SetIndexStyle(0,DRAW_LINE);
   SetIndexBuffer(0,thresholdBuffer);
   SetIndexStyle(1,DRAW_SECTION);
   SetIndexBuffer(1,vol_m);
   SetIndexStyle(2,DRAW_LINE);
   SetIndexBuffer(2,vol_t);

   ArrayResize(ind_c,Bars);
   ArrayInitialize(ind_c,0.0);
//----
   return(0);
  }
//+------------------------------------------------------------------+
//| Custor indicator deinitialization function                       |
//+------------------------------------------------------------------+
int deinit()
  {
//----

//----
   return(0);
  }
//+------------------------------------------------------------------+
//| Custom indicator iteration function                              |
//+------------------------------------------------------------------+
int start()
  {
   double vol=0;
   int    changed_bars=IndicatorCounted();
   //Comment("ATR ratio= "+short_atr+" / "+long_atr);
   int limit=Bars-changed_bars;
   if (limit>Sedimentation+5)limit=limit-Sedimentation;
   for(int i=limit;i>=0;i--)
   {

      double sa=iATR(NULL,0,Viscosity,i);
      double s1=ind_c[i+1];
      double s3=ind_c[i+3];
      double atr=NormalizeDouble(sa,Digits);
      if(lag_supressor)
         vol= sa/iATR(NULL,0,Sedimentation,i)+lag_s_K*(s1-s3);
      else
         vol= sa/iATR(NULL,0,Sedimentation,i);
      //vol_m[i]=vol;

      double anti_thres=iStdDev(NULL,0,Viscosity,0,MODE_LWMA,PRICE_TYPICAL,i);

      anti_thres=anti_thres/
                 iStdDev(NULL,0,Sedimentation,0,MODE_LWMA,PRICE_TYPICAL,i);

      double t=Threshold_level;
      t=t-anti_thres;

      if (vol>t){vol_t[i]=vol;vol_m[i]=vol;
                  IndicatorShortName("DAMIANI Signal/Noise: TRADE  /  ATR= "+DoubleToStr(atr,Digits)+"    values:");}
      else {vol_t[i]=vol;vol_m[i]=EMPTY_VALUE;
               IndicatorShortName("DAMIANI Signal/Noise: DO NOT trade  /  ATR= "+DoubleToStr(atr,Digits)+"    values:");}
      ind_c[i]=vol;
      thresholdBuffer[i]=t;
   }
//----

//----
   return(0);
  }
//+------------------------------------------------------------------+
Comments