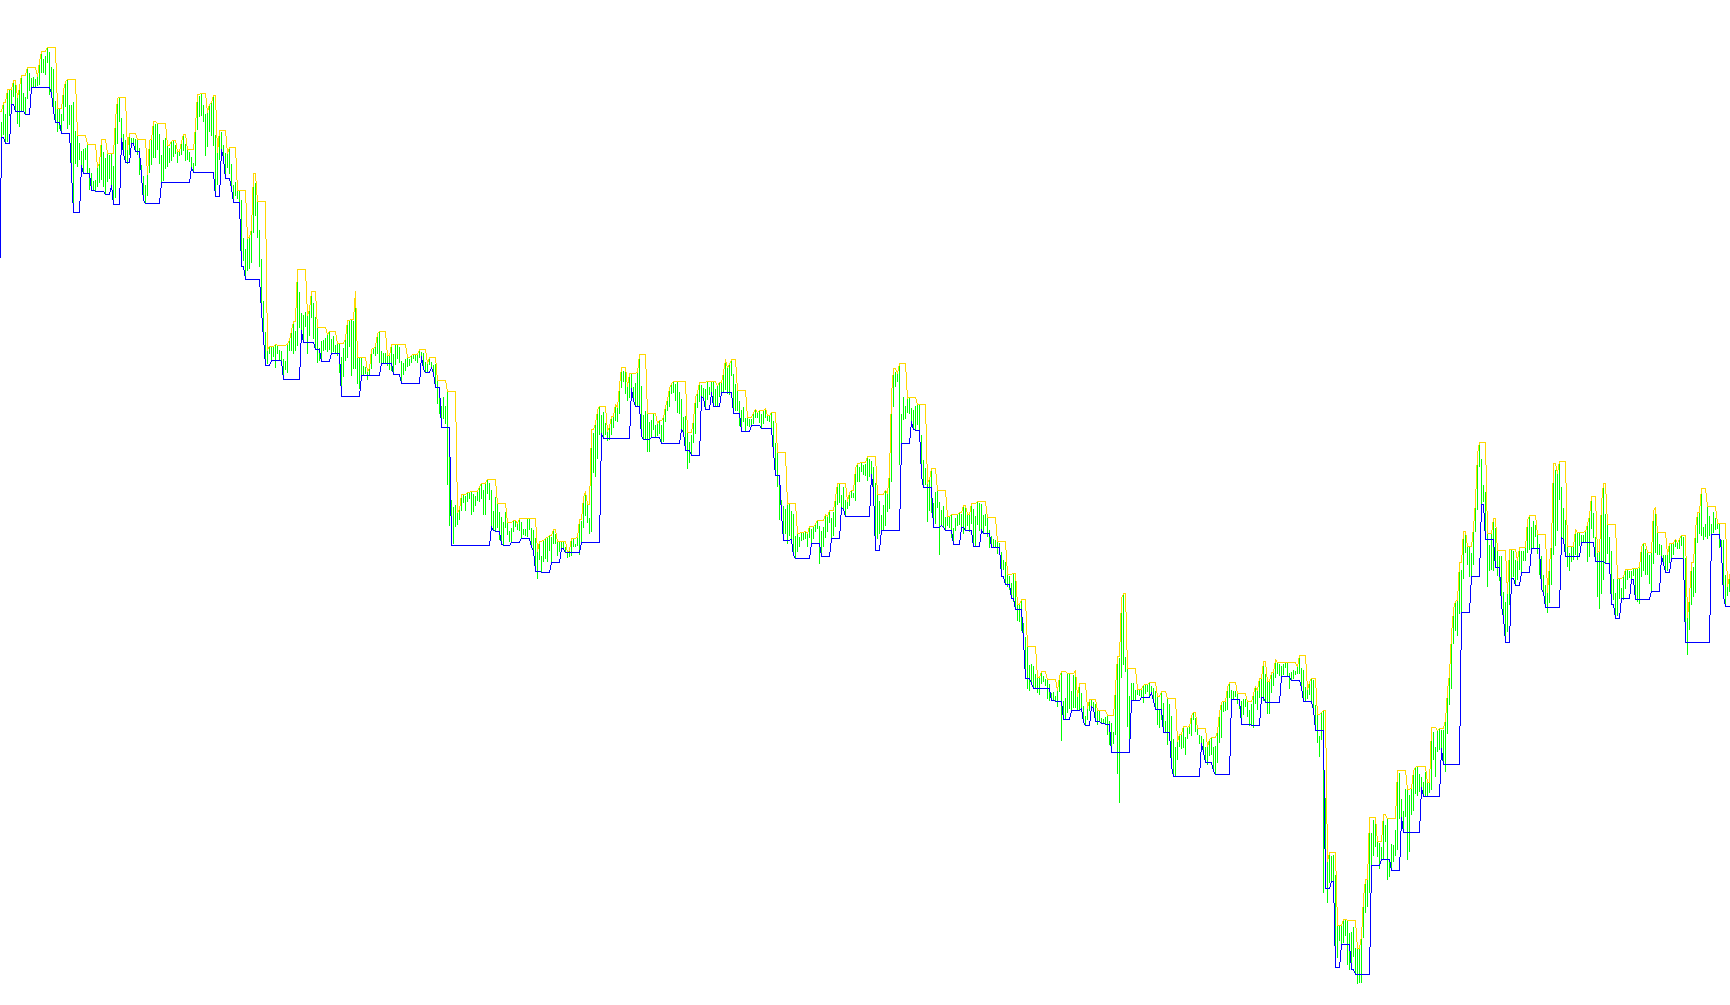
This tool is designed to identify and visualize specific price trends on a trading chart by creating "Darvas Boxes." The primary purpose of this logic is to help traders identify breakout points by mapping out periods of price consolidation versus periods of significant movement.
How the Logic Works
The script analyzes historical price data by moving backward through each bar (candle) on your chart. It evaluates the relationship between the highs and lows of these candles to determine the boundaries of a "box."
Here is the step-by-step breakdown of how the logic processes the market:
- Identifying Trends: The script looks for a sequence of price movements to establish a stable range. It tracks whether the current candle's high is breaking above previous levels or if it is staying within a defined boundary.
- Defining the Boundaries: As the script scans the candles, it constantly updates two key values:
- The Top Boundary: The highest price reached during a specific trend segment.
- The Bottom Boundary: The lowest price reached during that same segment.
- The State Transition System: The logic operates through a series of internal stages (states). It moves from one state to the next as it confirms that the price is remaining contained. For example, it checks if the price is failing to break out of the current "top" before deciding whether to solidify the "bottom" of the box.
- Consolidation Detection: If a new candle's high exceeds the established top boundary, the script recognizes this as a potential trend change and adjusts its tracking to start identifying a new price range.
- Visual Output: The results are plotted on your chart as two distinct lines representing the upper and lower limits of these boxes. This allows you to see clearly where the market is "ranging" (staying inside the box) and where it might be preparing for a breakout.
Summary for Traders
Instead of showing every tiny price fluctuation, this script filters out the noise to show you the "ceiling" and "floor" of current market behavior. It helps you visualize support and resistance levels dynamically, making it easier to spot when the price is being compressed into a box or when it is finally breaking free in a new direction.
//+------------------------------------------------------------------+
//|                                                 Darvas Boxes.mq4 |
//|                      Copyright © 2004, MetaQuotes Software Corp. |
//|                                        http://www.metaquotes.net |
//+------------------------------------------------------------------+
#property copyright "Copyright © 2004, MetaQuotes Software Corp."
#property link      "http://www.metaquotes.net"

#property indicator_chart_window
#property indicator_buffers 2
#property indicator_color1 Red
#property indicator_color2 Red

double     ind_buffer1[];
double     ind_buffer2[];

bool allow_buy;
bool allow_sell;
double price;


//+------------------------------------------------------------------+
//| Custom indicator initialization function                         |
//+------------------------------------------------------------------+
int init()
  {
//---- indicators
   SetIndexStyle(0,DRAW_LINE);
   SetIndexDrawBegin(0,0);
   SetIndexBuffer(0, ind_buffer1);

   SetIndexStyle(1,DRAW_LINE);
   SetIndexDrawBegin(1,2);
   SetIndexBuffer(1, ind_buffer2);

   allow_buy = true;
   allow_sell = false;


//----
   return(0);
  }
//+------------------------------------------------------------------+
//| Custor indicator deinitialization function                       |
//+------------------------------------------------------------------+
int deinit()
  {
//---- TODO: add your code here

//----
   return(0);
  }
//+------------------------------------------------------------------+
//| Custom indicator iteration function                              |
//+------------------------------------------------------------------+
int start()
  {
   int    counted_bars=IndicatorCounted();
//---- TODO: add your code here


   double box_top = 0;
   double box_bottom = 0;
   int state = 1;


   for (int i = Bars - 1; i > 0; i--)
   {
      if (state == 1)
      {
         box_top = High[i];
      }
      else if (state == 2)
      {
         if (box_top > High[i])
         {
         }
         else
         {
            box_top = High[i];
         }
      }
      else if (state == 3)
      {
         if (box_top > High[i])
         {
            box_bottom = Low[i];
         }
         else
         {
            box_top = High[i];
         }
      }
      else if (state == 4)
      {
         if (box_top > High[i])
         {
            if (box_bottom < Low[i])
            {
            }
            else
            {
               box_bottom = Low[i];
            }
         }
         else
         {
            box_top = High[i];
         }
      }
      else if (state == 5)
      {
         if (box_top > High[i])
         {
            if (box_bottom < Low[i])
            {
            }
            else
            {
               box_bottom = Low[i];
            }
         }
         else
         {
            box_top = High[i];
         }
         state = 0;
      }

      ind_buffer1[i] = box_top;

      ind_buffer2[i] = box_bottom;


      state++;
   }

   ind_buffer1[0] = EMPTY_VALUE;
   ind_buffer2[0] = EMPTY_VALUE;


//----
   return(0);
  }
//+------------------------------------------------------------------+
Comments