Damiani_volatmeter2.i
Download script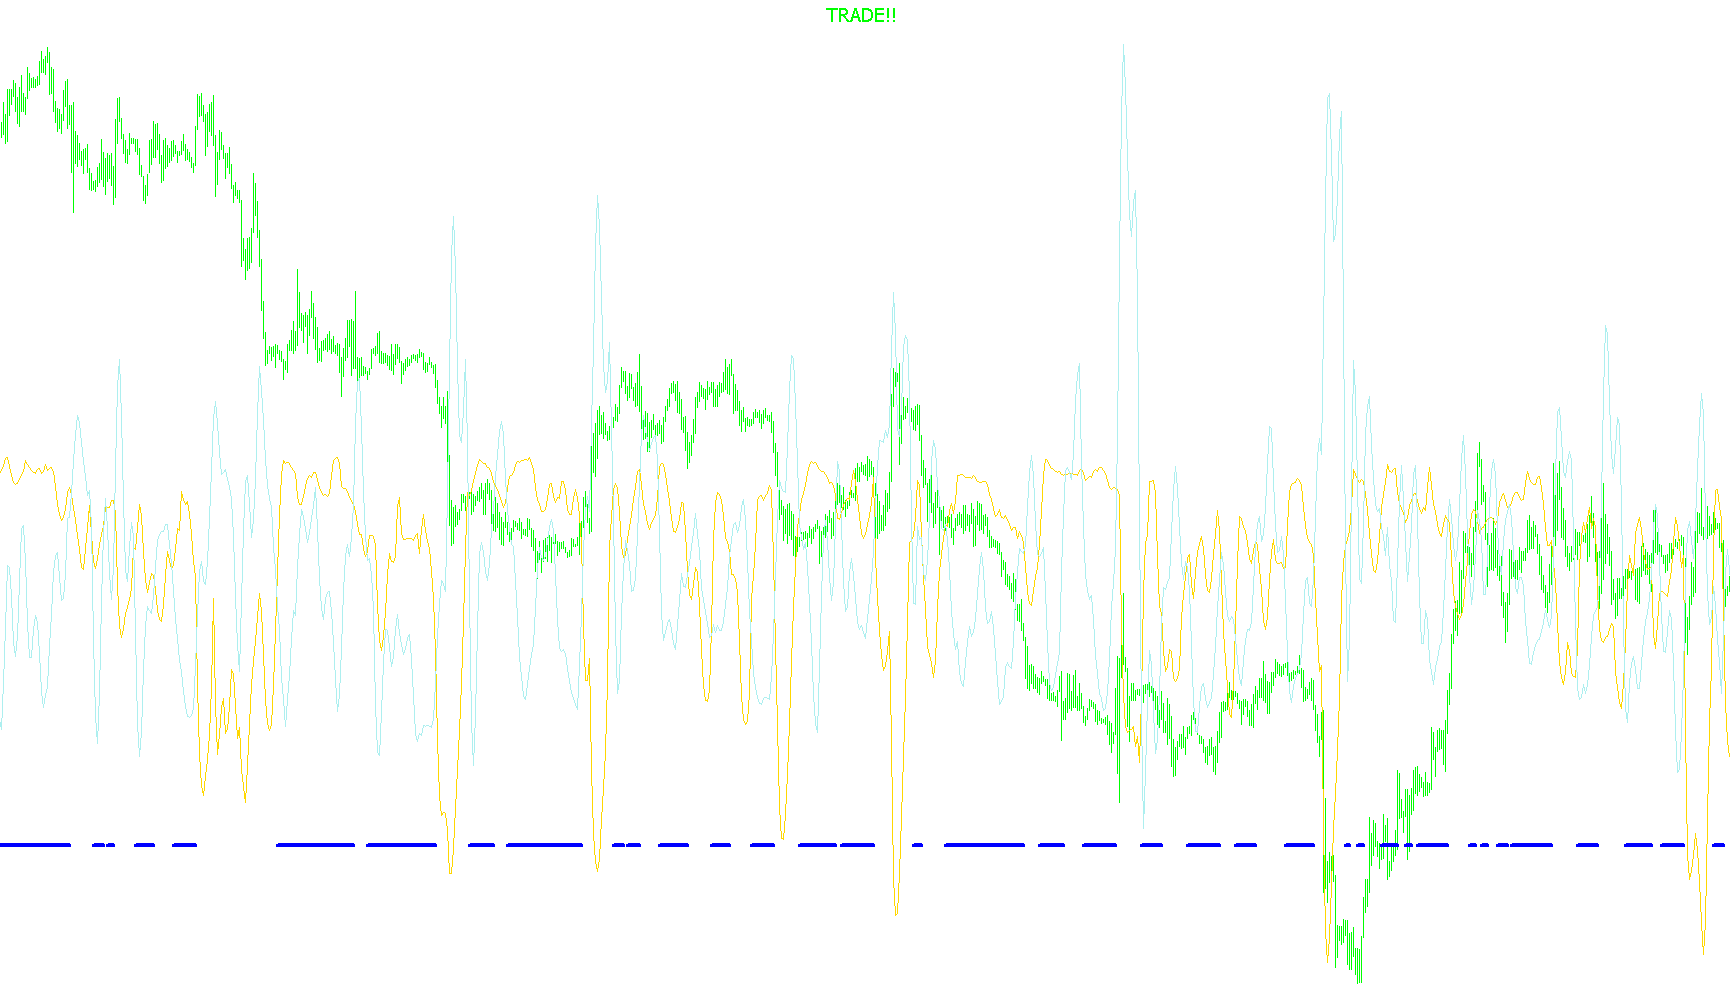
This technical indicator, known as the Damiani Volatmeter, is designed to provide traders with a clear visual signal regarding market volatility and trading conditions. Its primary purpose is to act as a "filter," helping users distinguish between periods where the market is providing enough movement to be profitable and periods where it is too quiet or inconsistent to justify an entry.
How the Logic Works
The script operates by comparing two different measures of market activity (volatility) across different time scales:
- Short-Term Activity: The tool looks at rapid, recent price fluctuations (defined by the "Viscosity" setting).
- Long-Term Context: It simultaneously analyzes the broader, more stable trend of the market (defined by the "Sedimentation" setting).
By dividing the short-term activity by the long-term context, the script calculates a relative volatility score. This allows the tool to see not just how much the price is moving, but whether that movement is significant enough compared to the recent history of the asset.
The Trading Signal
The indicator visualizes this data using lines and dynamic text on your chart:
- The Threshold: The script calculates a "dynamic threshold" based on standard deviations. This represents the minimum level of activity required for a trade to be considered viable.
- The Volatility Line: The indicator plots a line showing the current volatility score.
- The Action Signal:
- Trade Opportunity: When the calculated volatility exceeds the dynamic threshold, the indicator signals that the market is active enough to trade. The on-screen text will display "TRADE!!" in lime green.
- No-Trade Zone: If the volatility falls below that threshold, it indicates that the market is too sluggish or lacks sufficient momentum. The on-screen text will alert you with "DO NOT TRADE!" in red.
Key Features for the User
- Lag Suppression: The script includes a specific mechanism to reduce "lag"—the delay between a price movement and its appearance on an indicator. This helps ensure that the signals are as close to real-time as possible.
- Visual Dashboard: Instead of making the user do complex math, the script provides a live text label on the chart that updates automatically, showing you exactly what action the logic suggests based on current conditions.
- Customizable Sensitivity: Through the input parameters, users can adjust how "sensitive" the tool is to short-term spikes versus long-term trends, allowing it to be tuned to different styles of trading or specific currency pairs.
//+------------------------------------------------------------------+
//|                                           Damiani_volatmeter.mq4 |
//|                         Copyright © 2006, Luis Guilherme Damiani |
//|                                      http://www.damianifx.com.br |
//+------------------------------------------------------------------+
//When the green line is BELOW the gray line - DON'T trade
#property copyright "Copyright © 2006, Luis Guilherme Damiani"
#property link      "http://www.damianifx.com.br"

#property indicator_separate_window
#property indicator_buffers 3
#property indicator_color1 Silver
#property indicator_color2 Red
#property indicator_color3 Lime
//---- input parameters
extern int       Viscosity=10;
extern int       Sedimentation=60;
extern double    Threshold_level=1.4;
extern bool      lag_supressor=true;
double    lag_s_K=0.5;
extern bool      InfoOnly=false;

//---- buffers
double thresholdBuffer[];
double vol_m[];
double vol_t[];
double ind_c[];
//+------------------------------------------------------------------+
//| Custom indicator initialization function                         |
//+------------------------------------------------------------------+
int init()
  {
//---- indicators
   IndicatorBuffers(4);
   if(InfoOnly)double draw=DRAW_NONE; else draw=DRAW_LINE;

   SetIndexStyle(0,draw);
   SetIndexBuffer(0,thresholdBuffer);
   SetIndexStyle(1,DRAW_LINE,0,4);
   SetIndexBuffer(1,vol_m);
   SetIndexStyle(2,draw);
   SetIndexBuffer(2,vol_t);
      SetIndexLabel(0,"DVolt");
      SetIndexLabel(1,"DVolt DO NOT Trade");
      SetIndexLabel(2,"DVolt");
   SetIndexBuffer(3,ind_c);


   ArrayResize(ind_c,Bars);
   ArrayInitialize(ind_c,0.0);

//---info hozza
    // now we will crate a text mark.
   // for this use the function ObjectCreate.
   // do not indicate coordinates
   ObjectCreate("signal",OBJ_LABEL,0,0,0,0,0);

   // change the x-coordinate
   ObjectSet("signal",OBJPROP_XDISTANCE,830);

   // change the y-coordinate
   ObjectSet("signal",OBJPROP_YDISTANCE,5);

   // to indicate the mark text, use the following function
   ObjectSetText("signal","Baj van",14,"Tahoma",Gold);

   // "signal" - object name
   // "lambada" - text
   // 14 - font size
   // Gold - color


//----
   return(0);
  }
//+------------------------------------------------------------------+
//| Custor indicator deinitialization function                       |
//+------------------------------------------------------------------+
int deinit()
  {
//----
   ObjectsDeleteAll();

//----
   return(0);
  }
//+------------------------------------------------------------------+
//| Custom indicator iteration function                              |
//+------------------------------------------------------------------+
int start()
  {
   double vol=0;
   int    changed_bars=IndicatorCounted();
   //Comment("ATR ratio= "+short_atr+" / "+long_atr);
   if(changed_bars < 0) return(-1);
   if(changed_bars > 0) changed_bars--;
   int limit=Bars-changed_bars;
//   limit=MathMax(limit,Sedimentation);

//   if (limit>Sedimentation+5)limit=limit-Sedimentation;
   for(int i=limit;i>=0;i--)
   {
      double sa=iATR(NULL,0,Viscosity,i);
      double s1=ind_c[i+1];
      double s3=ind_c[i+3];
      double atr=NormalizeDouble(sa,Digits);
      double atrsd= iATR(NULL,0,Sedimentation,i);
         if (atrsd!=0)
         {
      if(lag_supressor)
         vol= sa/atrsd+lag_s_K*(s1-s3);
      else
         vol= sa/atrsd;
         }
      //vol_m[i]=vol;
      double anti_thres1=iStdDev(NULL,0,Viscosity,0,MODE_LWMA,PRICE_TYPICAL,i);
      double stdsed = iStdDev(NULL,0,Sedimentation,0,MODE_LWMA,PRICE_TYPICAL,i);
      if (stdsed!=0)

      double  anti_thres=anti_thres1/stdsed;

      double t=Threshold_level;
      t=t-anti_thres;

      if (vol>t){vol_t[i]=vol;vol_m[i]=EMPTY_VALUE;//=vol;
                  IndicatorShortName(" HAJRÁ FIÚK!  /  ATR= "+DoubleToStr(atr,Digits)+"    values:");
                  ObjectSetText("signal","TRADE!!",14,"Tahoma",Lime);
                  }
      else {vol_t[i]=vol;vol_m[i]=0.0;
               IndicatorShortName(" DO NOT  /  ATR= "+DoubleToStr(atr,Digits)+"    values:");
               ObjectSetText("signal","DO NOT TRADE!",14,"Tahoma",Red);}
      ind_c[i]=vol;
      thresholdBuffer[i]=t;
   }
//----

//----
   return(0);
  }
//+------------------------------------------------------------------+
Comments