Darma Pivots
Download script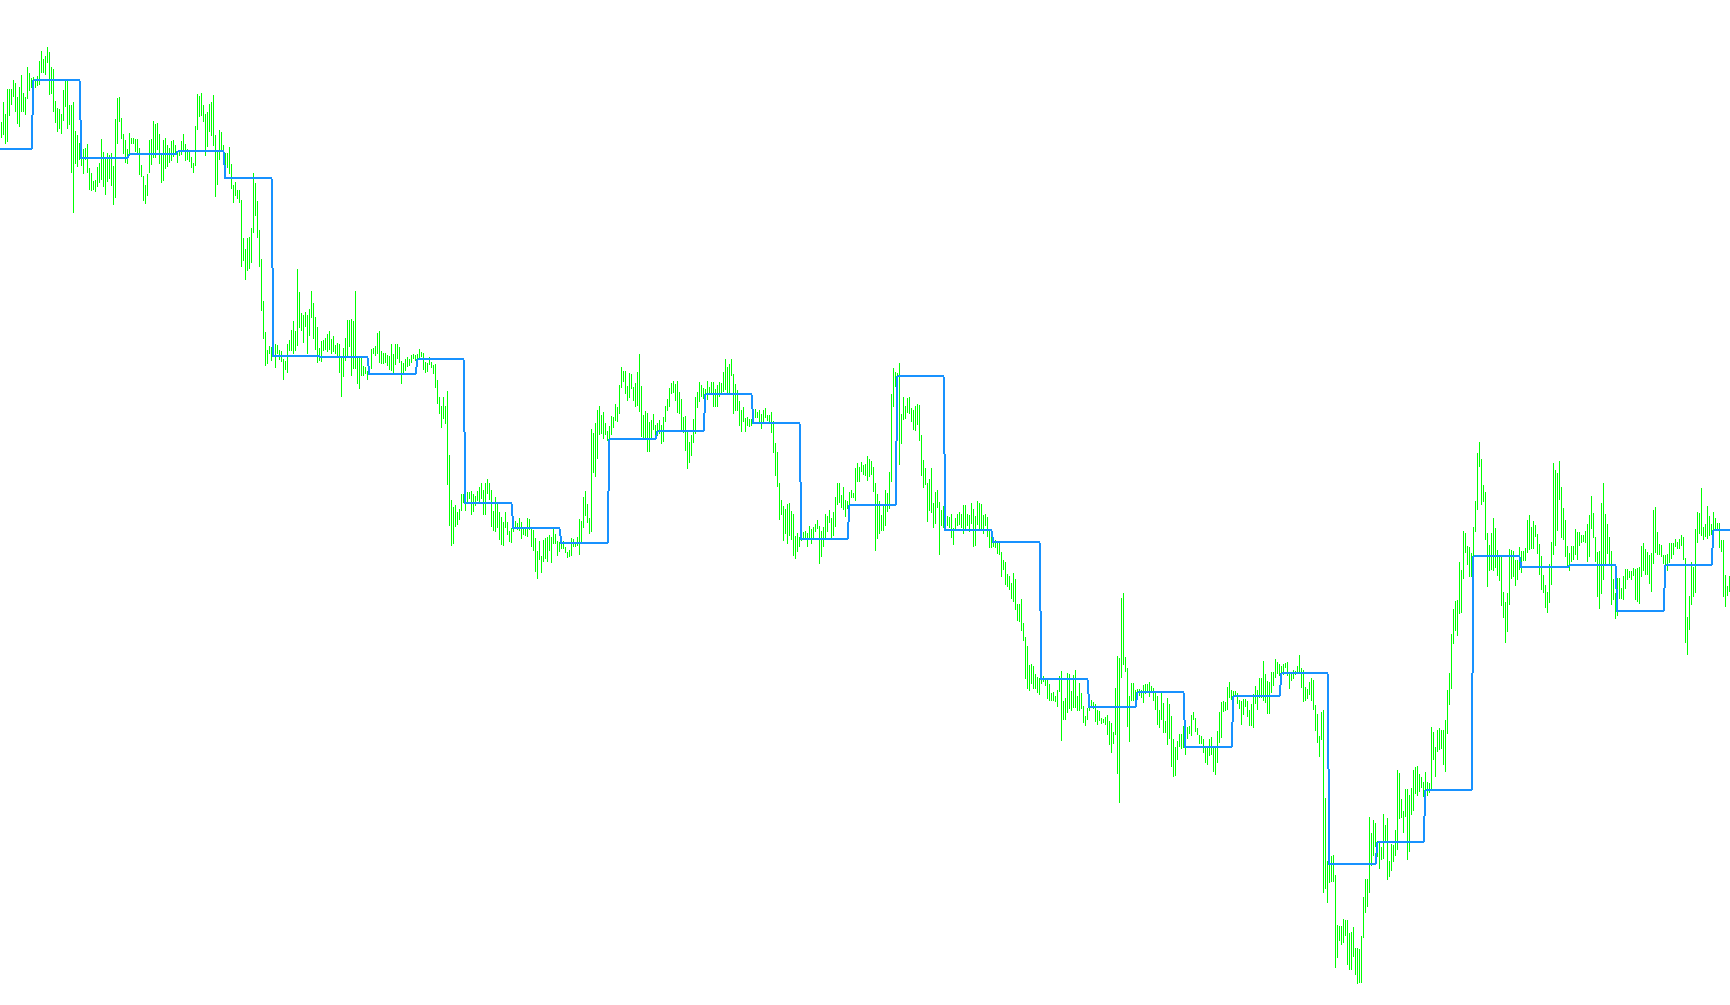
This script is a technical analysis tool designed to automatically calculate and display Pivot Points on your trading charts. Pivot points are essential levels used by traders to identify potential areas of support (where prices may stop falling) and resistance (where prices may stop rising).
How the Logic Works
The script works by analyzing historical price data—specifically the high, low, and closing prices—to project key levels for the current trading session. Here is a breakdown of its internal logic:
1. Time-Based Detection The tool monitors the time on your chart. When it detects a specific time (the "change of day" hour), it triggers a calculation. It captures the market data from the previous period to establish the baseline for the new session's levels.
2. Automated Level Calculations Once the new session begins, the script performs several mathematical operations to generate different types of Pivot levels:
- Standard Pivot Points: It calculates middle grounds based on various combinations of the previous high, low, and close prices.
- Resistance Levels (R3, R4): These represent "ceilings" where the price might struggle to climb higher. They are calculated by projecting the distance between the pivot and the previous lows.
- Support Levels (S3, S4): These represent "floors" where the price might find a base. They are calculated by projecting the distance between the pivot and the previous highs.
- Daily Open: The script can also track and display the exact opening price of the day.
3. Dynamic Tracking As the market moves in real-time, the script continuously updates the "High" and "Low" values for the current day. This ensures that as new peaks or troughs are reached, the calculations remain accurate relative to the current day's price action.
Customization Options
The script is designed with several "toggle" features that allow you to choose which specific data points you want to see on your screen:
- Variable Pivot Types: You can choose to display different versions of Pivot 1 through 4 based on whether you prefer to include the closing price or only the high/low extremes.
- Support & Resistance Toggles: You can turn on or off the more advanced R3, S3, R4, and S4 levels depending on your specific trading strategy.
- Visual Customization: The script automatically handles the drawing of these lines, using different styles (such as dashed vs. solid lines) to help you distinguish between standard pivots and extra resistance/support levels at a glance.
//+------------------------------------------------------------------+
//|                                                            PIVOT |
//|                                                            Darma |
//|                                              http://darmasdt.com |
//+------------------------------------------------------------------+
#property copyright "Darma"
#property link      "http://groups.yahoo.com/group/indotraders"

#property indicator_chart_window
#property indicator_buffers 8
#property indicator_color1 Red
#property indicator_color2 Goldenrod
#property indicator_color3 Blue
#property indicator_color4 Black
#property indicator_color5 Green
#property indicator_color6 Green
#property indicator_color7 Green
#property indicator_color8 Green

//---- input parameters
extern int change_day_hour=0;
extern bool HLCCper4=false;
extern bool HLCper3=false;
extern bool HLper2=false;
extern bool DailyOpen=true;
extern bool Sup_Res4=false;
extern bool Sup_Res3=false;

//---- buffers
double Pivot4[];
double Pivot3[];
double Pivot2[];
double Pivot1[];
double Res4[];
double Sup4[];
double Res3[];
double Sup3[];


//---- variables
int limit, cur_day, prev_day, barChangeDay;
double y_c,t_o,y_h,y_l,P4,P3,P2,R4,S4,R3,S3;
double day_high, day_low, dayHprev, dayLprev;

//+------------------------------------------------------------------+
//| Custom indicator initialization function                         |
//+------------------------------------------------------------------+
int init()
  {
//---- indicators
   SetIndexStyle(0,DRAW_LINE,STYLE_DASHDOTDOT,1);
   SetIndexBuffer(0,Pivot4);
   SetIndexStyle(1,DRAW_LINE,STYLE_DASHDOTDOT,1);
   SetIndexBuffer(1,Pivot3);
   SetIndexStyle(2,DRAW_LINE,STYLE_DASHDOTDOT,1);
   SetIndexBuffer(2,Pivot2);
   SetIndexStyle(3,DRAW_LINE,STYLE_SOLID,2);
   SetIndexBuffer(3,Pivot1);
   SetIndexStyle(4,DRAW_LINE,STYLE_DASHDOTDOT,1);
   SetIndexBuffer(4,Res4);
   SetIndexStyle(5,DRAW_LINE,STYLE_DASHDOTDOT,1);
   SetIndexBuffer(5,Sup4);
   SetIndexStyle(6,DRAW_LINE,STYLE_DASHDOTDOT,1);
   SetIndexBuffer(6,Res3);
   SetIndexStyle(7,DRAW_LINE,STYLE_DASHDOTDOT,1);
   SetIndexBuffer(7,Sup3);
//----
   return(0);
  }
//+------------------------------------------------------------------+
//| Custom indicator deinitialization function                       |
//+------------------------------------------------------------------+
int deinit()
  {
//---- TODO: add your code here
   ObjectsRedraw();
//----
   return(0);
  }
//+------------------------------------------------------------------+
//| Custom indicator iteration function                              |
//+------------------------------------------------------------------+
int start()
  {

int counted_bars=IndicatorCounted();
if (counted_bars<0) return(-1);
if (counted_bars>0) counted_bars--;

limit=Bars-counted_bars;
//----
   for(int i=limit; i>=0; i--)
      {

        cur_day = TimeDay(Time[i]);

        if  (
            TimeHour(Time[i]) == change_day_hour &&
            TimeMinute(Time[i]) == 0
            )
            {
            barChangeDay = i;
            y_c = Close[i+1];
            t_o = Open[i];
            y_h = day_high;
            y_l = day_low;

            P4 = (y_h + y_l + y_c + t_o) / 4;
            P3 = (y_h + y_l + y_c) / 3;
            P2 = (y_h + y_l) / 2;

            R4 = P4 + (P4 - y_l);
            R3 = P3 + (P3 - y_l);

            S4 = P4 + (P4 - y_h);
            S3 = P3 + (P3 - y_h);

            day_high = High[i];
            day_low  = Low[i];
            } // if

        dayHprev = day_high;
        dayLprev = day_low;

        day_high = MathMax(day_high, High[i]);
        day_low = MathMin(day_low, Low[i]);

        if (HLCCper4)
           {
           Pivot4[i]=P4;
           }
        if (HLCper3)
           {
           Pivot3[i]=P3;
           }
        if (HLper2)
           {
           Pivot2[i]=P2;
           }
        if (DailyOpen)
           {
           Pivot1[i]=t_o;
           }
        if (Sup_Res4)
           {
           Res4[i]=R4;
           Sup4[i]=S4;
           }
        if (Sup_Res3)
           {
           Res3[i]=R3;
           Sup3[i]=S3;
           }


      } // for

//---- done


   return(0);
  }
//+------------------------------------------------------------------+
Comments