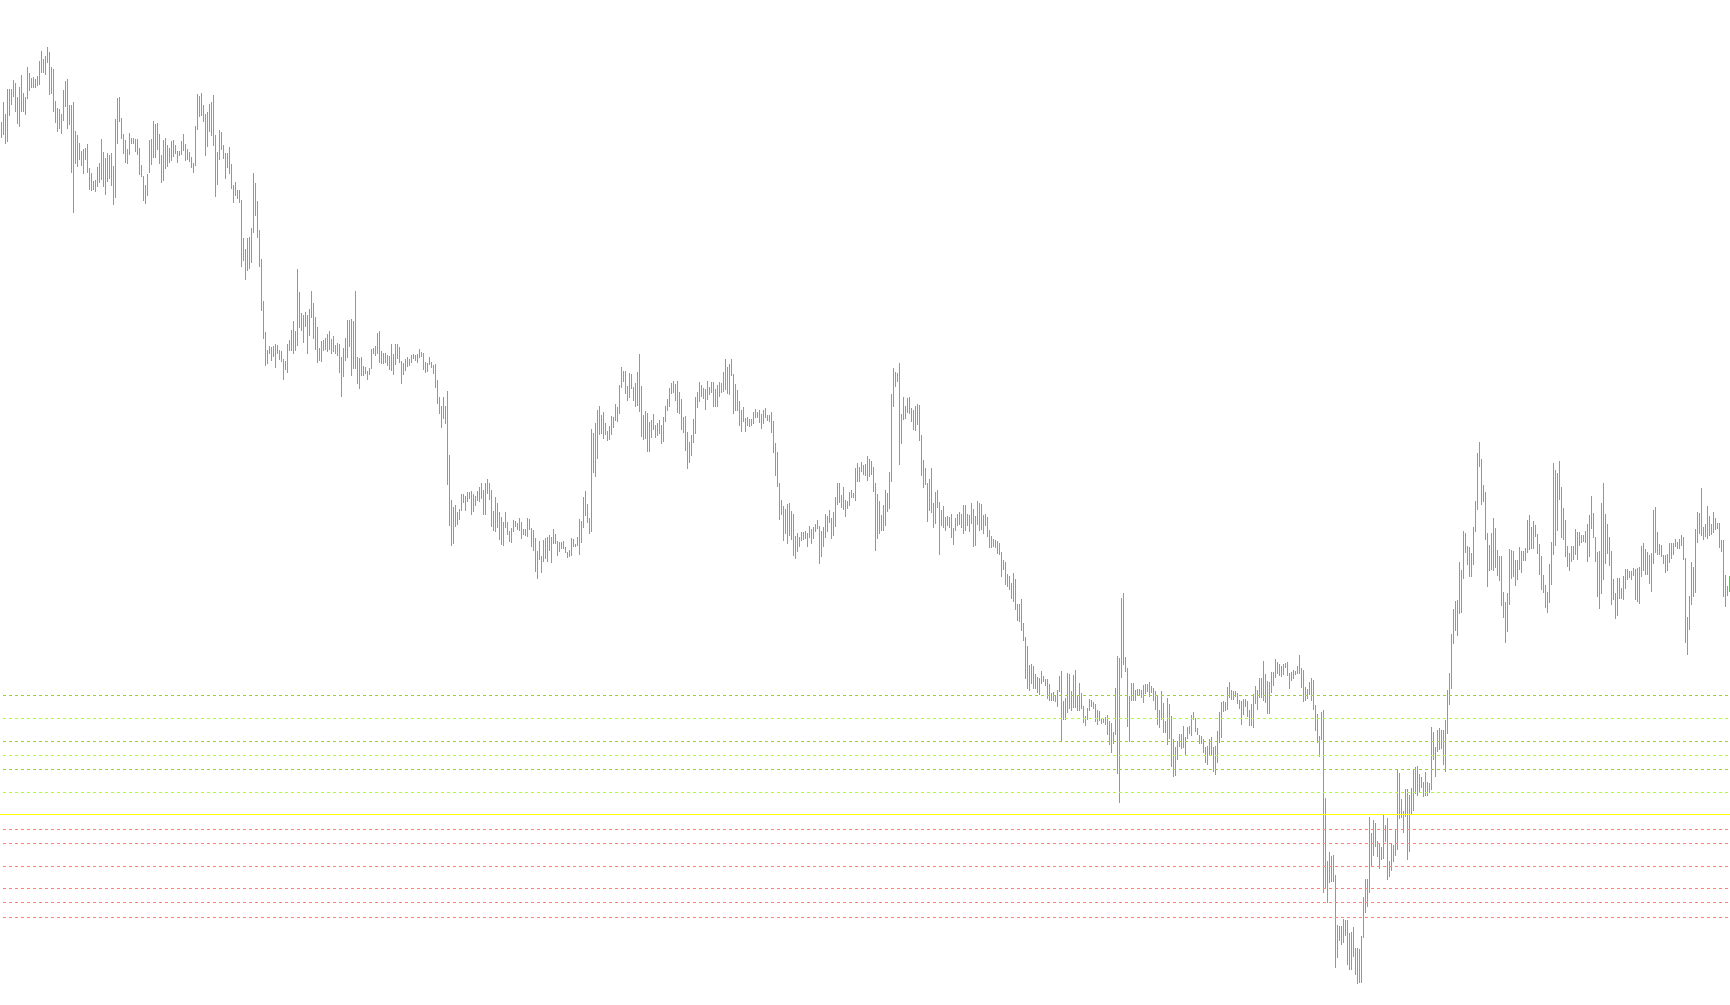
This script is designed for the MetaTrader 4 platform to automatically calculate and display Daily Pivot Points on your trading charts. Pivot points are standard technical analysis tools used by traders to identify potential support and resistance levels—price areas where the market may encounter difficulty moving higher or lower.
Core Functionality
The logic of this script can be broken down into three main components: Data Gathering, Calculation Methods, and Visual Mapping.
1. Data Gathering
To provide accurate daily levels, the script automatically looks at "Daily" price history. Specifically, it retrieves four key pieces of information from the previous trading day:
- The highest price reached (High)
- The lowest price reached (Low)
- The closing price (Close)
- The opening price of the current day (Open)
2. Calculation Methods
The script offers different mathematical "formulas" to determine where the pivot points should sit. Depending on your preference, it can calculate these levels in three distinct ways:
- Standard Pivot: A balanced calculation using the high, low, close, and open.
- Alternative Formulas: The script includes three specific modes that slightly weight the importance of the previous day's range to provide different variations of Support and Resistance.
3. Visual Output and Mapping
Once the calculations are finished, the script draws several horizontal lines on your chart to serve as visual guides:
- The Pivot Point: This is the "center" price level for the day. It acts as the primary balance point.
- Support and Resistance Levels: The script goes beyond just the main pivot. It calculates a comprehensive grid of levels (labeled as 0.5, 1.0, 1.5, 2.0, 2.5, and 3.0).
- Resistance Levels (R): These are plotted above the pivot point and represent "ceilings" where price might struggle to break through.
- Support Levels (S): These are plotted below the pivot point and represent "floors" where price might find a reason to bounce back up.
Key Features for the User
- Historical Lookback: You can choose how many days of historical data the script should analyze to populate the chart.
- Dynamic Updates: The script is designed to ensure that as new daily data arrives, the lines update to reflect the current trading environment.
- Visual Customization: It handles the creation and cleanup of all horizontal lines automatically, ensuring your chart stays organized and only shows the relevant data for the current period.
In short, this script automates the tedious math of calculating price floors and ceilings, providing you with a clear visual map of where traders might find significant "battlegrounds" during the trading day.
//+------------------------------------------------------------------+
//|                                             DailyPivotPoints.mq4 |
//|                      Copyright © 2005, MetaQuotes Software Corp. |
//|                                        http://www.metaquotes.net |
//+------------------------------------------------------------------+
#property copyright "Copyright © 2005, MetaQuotes Software Corp."
#property link      "http://www.metaquotes.net"

#property indicator_chart_window
#property indicator_buffers 2
#property indicator_color1 Blue
#property indicator_color2 Red
//---- input parameters
extern int       ExtFormula=0;
extern int       ExtHowManyDays=30;
extern bool      ExtDraw=true;
//---- buffers
double ExtMapBuffer1[];
double ExtMapBuffer2[];
//+------------------------------------------------------------------+
//| Custom indicator initialization function                         |
//+------------------------------------------------------------------+
int init()
  {
//---- indicators
   SetIndexStyle(0,DRAW_LINE);
   SetIndexBuffer(0,ExtMapBuffer1);
   SetIndexEmptyValue(0,0.0);
   SetIndexStyle(1,DRAW_LINE);
   SetIndexBuffer(1,ExtMapBuffer2);
   SetIndexEmptyValue(1,0.0);
//---- clear buffers when reinitializing
   if(ArraySize(ExtMapBuffer1)>0) ArrayInitialize(ExtMapBuffer1,0.0);
   if(ArraySize(ExtMapBuffer2)>0) ArrayInitialize(ExtMapBuffer2,0.0);
//---- set labels for DataWindow
   if(ExtDraw)
     {
      if(ExtFormula==0)
        {
         SetIndexLabel(0,"Pivot");
         SetIndexLabel(1,NULL);
        }
       else
        {
         SetIndexLabel(0,"Resistance");
         SetIndexLabel(1,"Support");
        }
     }
    else
     {
      SetIndexLabel(0,NULL);
      SetIndexLabel(1,NULL);
     }
//---- force daily data load
   iBars(NULL,PERIOD_D1);
//----
   return(0);
  }
//+------------------------------------------------------------------+
//| Custom indicator deinitialization function                       |
//+------------------------------------------------------------------+
int deinit()
  {
//---- deleting our lines
   ObjectDelete("Pivot_Line");
   ObjectDelete("R0.5_Line");
   ObjectDelete("R1.0_Line");
   ObjectDelete("R1.5_Line");
   ObjectDelete("R2.0_Line");
   ObjectDelete("R2.5_Line");
   ObjectDelete("R3.0_Line");
   ObjectDelete("S0.5_Line");
   ObjectDelete("S1.0_Line");
   ObjectDelete("S1.5_Line");
   ObjectDelete("S2.0_Line");
   ObjectDelete("S2.5_Line");
   ObjectDelete("S3.0_Line");
//----
   return(0);
  }
//+------------------------------------------------------------------+
//| Custom indicator iteration function                              |
//+------------------------------------------------------------------+
int start()
  {
   int    counted_bars=IndicatorCounted();
   int    begin_bar, first_bar, last_bar, cnt;
   double yesterday_high, yesterday_low, yesterday_close, today_open;
   double P, S, R, S05, R05, S10, R10, S15, R15, S20, R20, S25, R25, S30, R30;
//---- test parameters
   if(ExtFormula<0 || ExtFormula>3) return(-1);
   if(Period()>=PERIOD_D1)          return(-1);
//---- if daily data not loaded yet
   while(true)
     {
      if(iTime(NULL,PERIOD_D1,0)>=(Time[0]-PERIOD_D1*60)) break;
      Sleep(1000);
     }
//---- set check beginning
   if(ExtHowManyDays<1) begin_bar=iBars(NULL,PERIOD_D1)-2;
   else                 begin_bar=ExtHowManyDays-1;
//---- case of recounting current pivot only
   if(ExtDraw==false || counted_bars>0) begin_bar=0;
//----
   for(cnt=begin_bar; cnt>=0; cnt--)
     {
      yesterday_close=iClose(NULL,PERIOD_D1,cnt+1);
      today_open=iOpen(NULL,PERIOD_D1,cnt);
      yesterday_high=iHigh(NULL,PERIOD_D1,cnt+1);
      yesterday_low=iLow(NULL,PERIOD_D1,cnt+1);
      P = (yesterday_high + yesterday_low + yesterday_close + today_open) / 4;
      switch(ExtFormula)
        {
         case 1 :
            R = P + P - yesterday_low;
            S = P + P - yesterday_high;
            break;
         case 2 :
            R = P + yesterday_high - yesterday_low;
            S = P - yesterday_high + yesterday_low;
            break;
         case 3 :
            R = P + P - yesterday_low - yesterday_low + yesterday_high;
            S = P + P - yesterday_high - yesterday_high + yesterday_low;
        }
      if(ExtDraw==true)
        {
         first_bar=iBarShift(NULL,0,iTime(NULL,PERIOD_D1,cnt))-1;
         if(cnt>0) last_bar=iBarShift(NULL,0,iTime(NULL,PERIOD_D1,cnt-1))-1;
         else last_bar=0;
         while(first_bar>=last_bar)
           {
            if(first_bar==last_bar && last_bar>0) break;
            if(ExtFormula==0) ExtMapBuffer1[first_bar]=P;
            else
              {
               ExtMapBuffer1[first_bar]=R;
               ExtMapBuffer2[first_bar]=S;
              }
             first_bar--;
           }
        }
     }
   P = NormalizeDouble((yesterday_high + yesterday_low + yesterday_close)/3,Digits);

   R10 = NormalizeDouble((2*P)-yesterday_low,Digits);
   S10 = NormalizeDouble((2*P)-yesterday_high,Digits);

   R05 = NormalizeDouble((P+R10)/2,Digits);
   S05 = NormalizeDouble((P+S10)/2,Digits);

   R20 = NormalizeDouble(P+(yesterday_high-yesterday_low),Digits);
   S20 = NormalizeDouble(P-(yesterday_high-yesterday_low),Digits);

   R15 = NormalizeDouble((R10+R20)/2,Digits);
   S15 = NormalizeDouble((S10+S20)/2,Digits);

   R30 = NormalizeDouble(2*P+(yesterday_high-2*yesterday_low),Digits);
   S30 = NormalizeDouble(2*P-(2*yesterday_high-yesterday_low),Digits);

   R25 = NormalizeDouble((R20+R30)/2,Digits);
   S25 = NormalizeDouble((S20+S30)/2,Digits);

   ObjectCreate("Pivot_Line", OBJ_HLINE, 0, 0, P);
   ObjectSet("Pivot_Line", OBJPROP_COLOR, Yellow);
   ObjectSet("Pivot_Line", OBJPROP_STYLE, STYLE_SOLID);
   ObjectSetText("Pivot_Line","Pivot "+DoubleToStr(P,Digits));

   ObjectCreate("R0.5_Line", OBJ_HLINE, 0, 0, R05);
   ObjectSet("R0.5_Line", OBJPROP_COLOR, GreenYellow);
   ObjectSet("R0.5_Line", OBJPROP_STYLE, STYLE_DOT);
   ObjectSetText("R0.5_Line","R0.5 "+DoubleToStr(R05,Digits));

   ObjectCreate("R1.0_Line", OBJ_HLINE, 0, 0, R10);
   ObjectSet("R1.0_Line", OBJPROP_COLOR, YellowGreen);
   ObjectSet("R1.0_Line", OBJPROP_STYLE, STYLE_DOT);
   ObjectSetText("R1.0_Line","R1.0 "+DoubleToStr(R10,Digits));

   ObjectCreate("R1.5_Line", OBJ_HLINE, 0, 0, R15);
   ObjectSet("R1.5_Line", OBJPROP_COLOR, GreenYellow);
   ObjectSet("R1.5_Line", OBJPROP_STYLE, STYLE_DOT);
   ObjectSetText("R1.5_Line","R1.5 "+DoubleToStr(R15,Digits));

   ObjectCreate("R2.0_Line", OBJ_HLINE, 0, 0, R20);
   ObjectSet("R2.0_Line", OBJPROP_COLOR, YellowGreen);
   ObjectSet("R2.0_Line", OBJPROP_STYLE, STYLE_DOT);
   ObjectSetText("R2.0_Line","R2.0 "+DoubleToStr(R20,Digits));

   ObjectCreate("R2.5_Line", OBJ_HLINE, 0, 0, R25);
   ObjectSet("R2.5_Line", OBJPROP_COLOR, GreenYellow);
   ObjectSet("R2.5_Line", OBJPROP_STYLE, STYLE_DOT);
   ObjectSetText("R2.5_Line","R2.5 "+DoubleToStr(R25,Digits));

   ObjectCreate("R3.0_Line", OBJ_HLINE, 0, 0, R30);
   ObjectSet("R3.0_Line", OBJPROP_COLOR, YellowGreen);
   ObjectSet("R3.0_Line", OBJPROP_STYLE, STYLE_DOT);
   ObjectSetText("R3.0_Line","R3.0 "+DoubleToStr(R30,Digits));

   ObjectCreate("S0.5_Line", OBJ_HLINE, 0, 0, S05);
   ObjectSet("S0.5_Line", OBJPROP_COLOR, Salmon);
   ObjectSet("S0.5_Line", OBJPROP_STYLE, STYLE_DOT);
   ObjectSetText("S0.5_Line","S0.5 "+DoubleToStr(S05,Digits));

   ObjectCreate("S1.0_Line", OBJ_HLINE, 0, 0, S10);
   ObjectSet("S1.0_Line", OBJPROP_COLOR, Salmon);
   ObjectSet("S1.0_Line", OBJPROP_STYLE, STYLE_DOT);
   ObjectSetText("S1.0_Line","S1.0 "+DoubleToStr(S10,Digits));

   ObjectCreate("S1.5_Line", OBJ_HLINE, 0, 0, S15);
   ObjectSet("S1.5_Line", OBJPROP_COLOR, Salmon);
   ObjectSet("S1.5_Line", OBJPROP_STYLE, STYLE_DOT);
   ObjectSetText("S1.5_Line","S1.5 "+DoubleToStr(S15,Digits));

   ObjectCreate("S2.0_Line", OBJ_HLINE, 0, 0, S20);
   ObjectSet("S2.0_Line", OBJPROP_COLOR, Salmon);
   ObjectSet("S2.0_Line", OBJPROP_STYLE, STYLE_DOT);
   ObjectSetText("S2.0_Line","S2.0 "+DoubleToStr(S20,Digits));

   ObjectCreate("S2.5_Line", OBJ_HLINE, 0, 0, S25);
   ObjectSet("S2.5_Line", OBJPROP_COLOR, Salmon);
   ObjectSet("S2.5_Line", OBJPROP_STYLE, STYLE_DOT);
   ObjectSetText("S2.5_Line","S2.5 "+DoubleToStr(S25,Digits));

   ObjectCreate("S3.0_Line", OBJ_HLINE, 0, 0, S30);
   ObjectSet("S3.0_Line", OBJPROP_COLOR, Salmon);
   ObjectSet("S3.0_Line", OBJPROP_STYLE, STYLE_DOT);
   ObjectSetText("S3.0_Line","S3.0 "+DoubleToStr(S30,Digits));
//---- force objects drawing
   ObjectsRedraw();
//----
   return(0);
  }
//+------------------------------------------------------------------+
Comments