Daily_range
Download script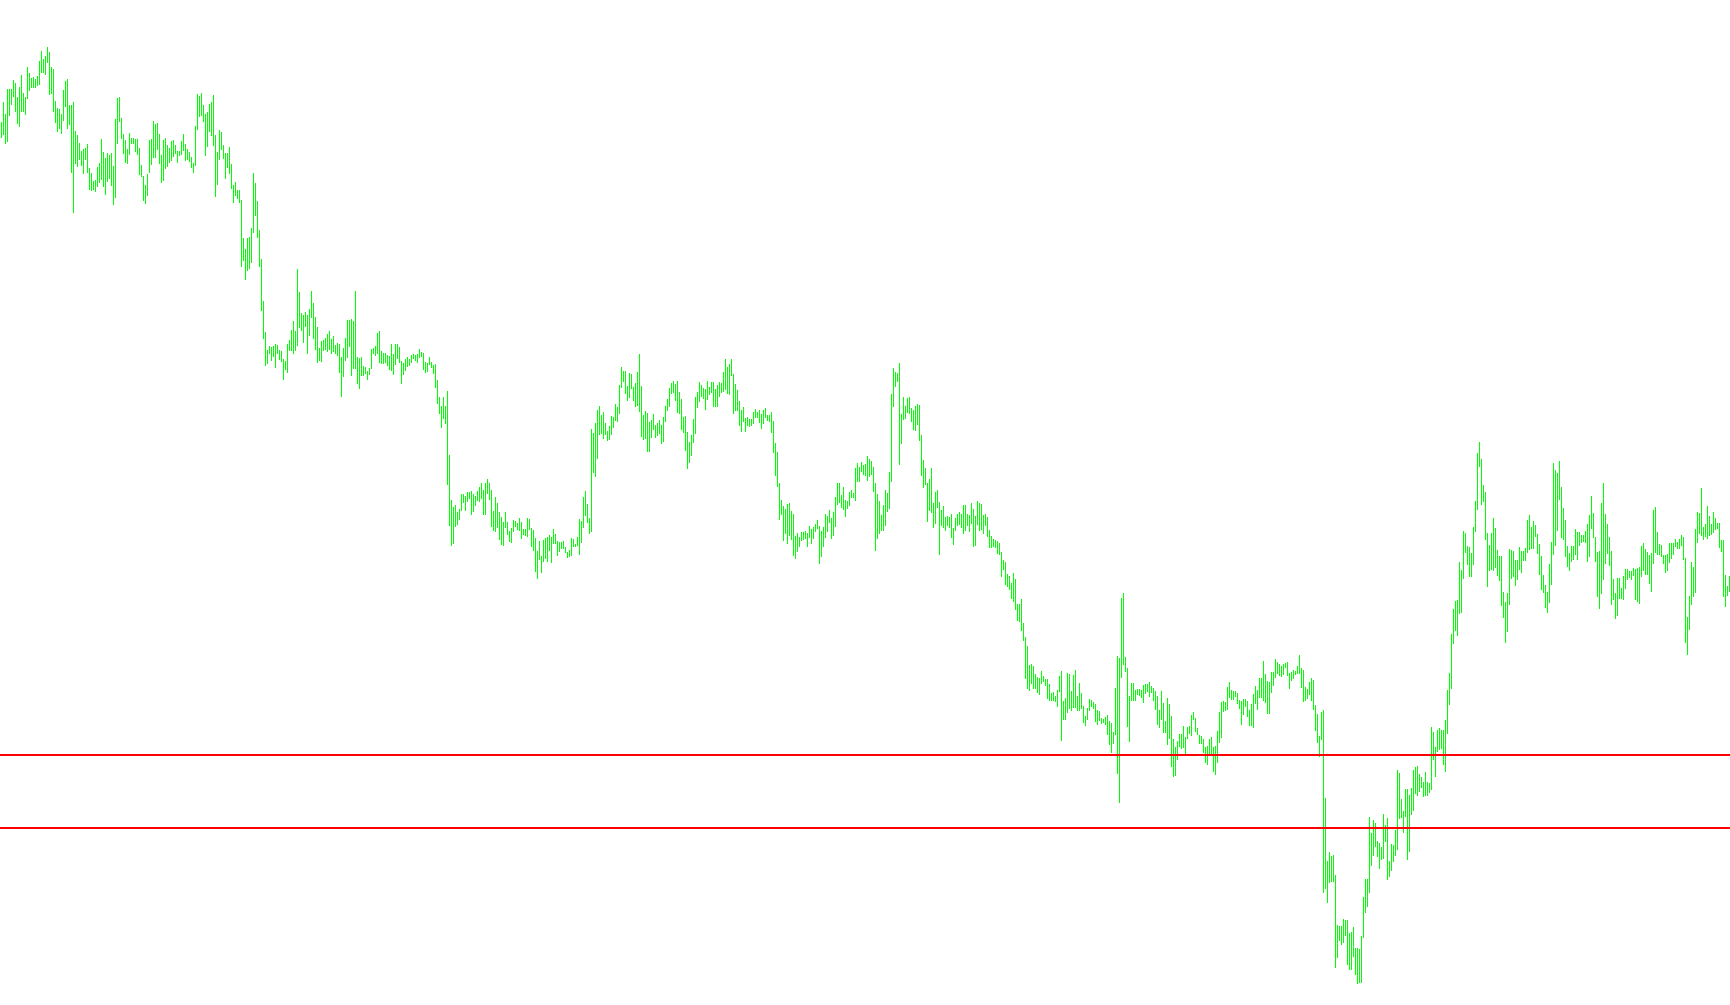
This tool is designed to help traders visualize key price levels based on the previous day's market activity. By analyzing the price movement of the daily candles, the script automatically identifies and plots specific horizontal lines on your chart to represent potential support and resistance zones.
How the Logic Works
1. Timeframe Awareness The script is built to be versatile across various timeframes (from 1-minute charts up to daily charts). It automatically detects which timeframe you are viewing and calculates the necessary time offsets to ensure that the data being pulled remains consistent, regardless of your current zoom level. However, it is specifically optimized for intraday trading and will notify you if you try to run it on a timeframe larger than one day.
2. Data Retrieval
The core logic begins by "looking back" at the previous day's price data. It pulls specific metrics from the Daily (D1) candles, focusing on high, low, open, and close prices. The StepBack setting allows users to choose how many days into the past the tool should look to gather this information.
3. Support and Resistance Calculation Instead of simply picking a random high or low point, the script uses a specific mathematical approach to determine the center of the price action:
- It compares the closing price of the previous day against the opening price.
- Depending on whether the market closed higher, lower, or equal to its opening price, it calculates a "median" value (represented as X).
- This median value is then used as a base point to project two distinct levels:
- Resistance: Derived by calculating the distance between the median and the previous day's high.
- Support: Derived by calculating the distance between the median and the previous day's low.
4. Visual Execution Once these values are calculated, the script draws two prominent red horizontal lines on your chart:
- DRes line: A visual indicator of where the price might face selling pressure.
- DSup line: A visual indicator of where the price might find buying support.
The tool is designed to be dynamic; as new price data arrives, it updates these lines automatically, providing a real-time visual guide to the daily trading range.
//+------------------------------------------------------------------+
//|                                                  Daily range.mq4 |
//|                                                         mishanya |
//|                                           www.fxtradercenter.com |
//+------------------------------------------------------------------+
#property copyright "mishanya"
#property link      "www.fxtradercenter.com"
#property indicator_chart_window
//----
extern int StepBack=0;
//----
double X,rates_d1[][6],sup,res;
int timeshift=0, timeshifts=0, beginner=0,d;
int periods;
//+------------------------------------------------------------------+
//| Custom indicator initialization function                         |
//+------------------------------------------------------------------+
int init()
  {
//---- indicators
//----
   return(0);
  }
//+------------------------------------------------------------------+
//| Custor indicator deinitialization function                       |
//+------------------------------------------------------------------+
int deinit()
  {
//---- TODO: add your code here
   ObjectDelete("DSup line");
   ObjectDelete("DRes line");
//----
   return(0);
  }
//+------------------------------------------------------------------+
//| Custom indicator iteration function                              |
//+------------------------------------------------------------------+
int start()
  {
   int    counted_bars=IndicatorCounted();
//---- TODO: add your code here
   d=1+StepBack;
   switch(Period())
     {
      case PERIOD_M1:  {timeshifts=60; beginner=Hour()*60;} break;
      case PERIOD_M5:  {timeshifts=300; beginner=Hour()*12;} break;
      case PERIOD_M15: {timeshifts=900; beginner=Hour()*4;} break;
      case PERIOD_M30: {timeshifts=1800; beginner=Hour()*2;} break;
      case PERIOD_H1:  {timeshifts=3600; beginner=Hour()*1;} break;
      case PERIOD_H4:  {timeshifts=14400; beginner=Hour()*0.25;} break;
      case PERIOD_D1:  {timeshifts=86400; beginner=Hour()*0;} break;
     }
   timeshift=timeshifts*24;
//----
   if(Period() > 86400)
     {
      Print("Error - Chart period is greater than 1 day.");
      return(-1); // then exit
     }
   ArrayCopyRates(rates_d1, Symbol(), PERIOD_D1);
//----
   if (rates_d1[d][4]<rates_d1[d][1]) X=(rates_d1[d][3]+rates_d1[d][2]+rates_d1[d][4]+rates_d1[d][2])/2;
   if (rates_d1[d][4]>rates_d1[d][1]) X=(rates_d1[d][3]+rates_d1[d][2]+rates_d1[d][4]+rates_d1[d][3])/2;
   if (rates_d1[d][4]==rates_d1[d][1]) X=(rates_d1[d][3]+rates_d1[d][2]+rates_d1[d][4]+rates_d1[d][4])/2;
//----
   sup=X - rates_d1[d][3];
   res=X - rates_d1[d][2];
   if (ObjectFind("DRes Line")!=0)
     {
      ObjectCreate("DRes line",OBJ_HLINE,0,Time[0],res);
      ObjectSet("DRes line",OBJPROP_COLOR,Red);
      ObjectSet("DRes line",OBJPROP_WIDTH,2);
     }
   else
     {
      ObjectMove("DRes line", 0,Time[0],res);
     }
   if (ObjectFind("DSup Line")!=0)
     {
      ObjectCreate("DSup line",OBJ_HLINE,0,Time[0],sup);
      ObjectSet("DSup line",OBJPROP_COLOR,Red);
      ObjectSet("DSup line",OBJPROP_WIDTH,2);
     }
   else
     {
      ObjectMove("DSup line", 0,Time[0],sup);
     }
//----
   return(0);
  }
//+------------------------------------------------------------------+
Comments