Bears
Download script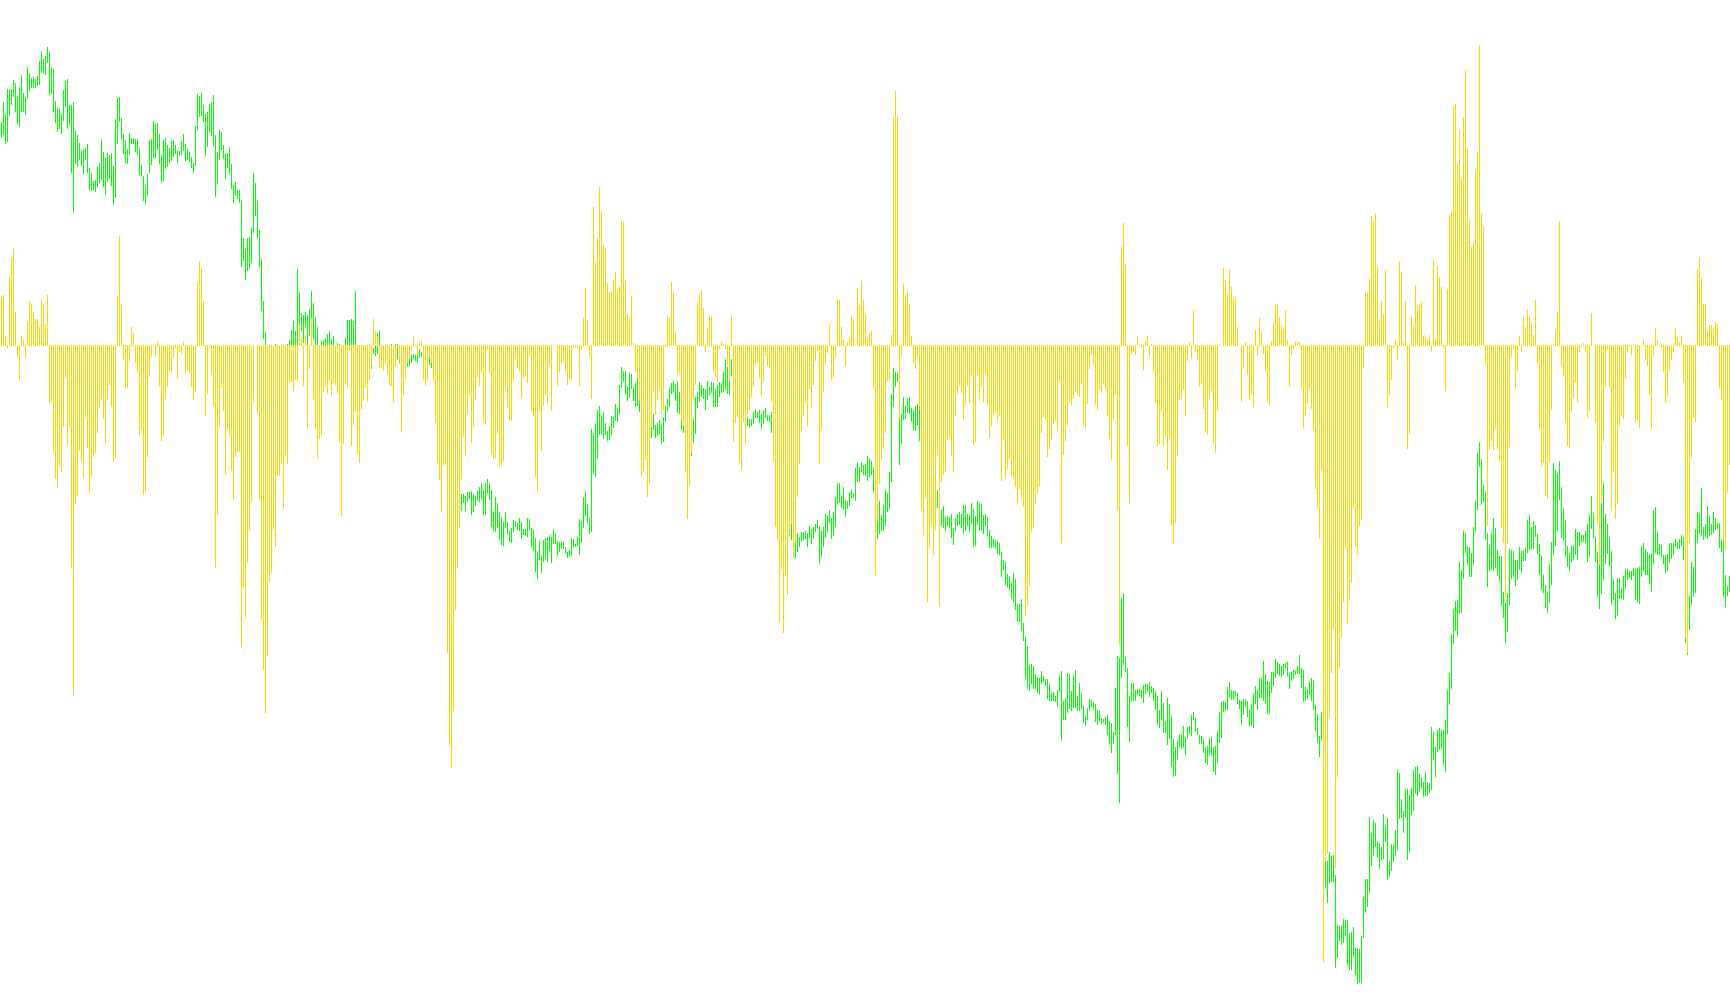
This tool is designed as a visual indicator for the MetaTrader platform to help traders identify specific price dynamics by measuring the "gap" between current market prices and a smoothed average.
How the Logic Works
The core purpose of this script is to calculate the difference between the actual low price of an asset and its moving average. To do this, it follows a three-step logical process:
1. Establishing a Baseline First, the tool calculates a "Moving Average." It looks at the closing prices over a specific number of candles (defined by the user as 13 periods by default). By using an Exponential Moving Average (EMA), the script creates a smoothed line that represents the general trend or "fair value" of the asset over that period.
2. Measuring the Deviation Instead of simply showing you where the price is, the script looks at the distance between the Low price (the lowest point reached during a specific time frame) and that calculated moving average. It essentially asks: "How far below the average trend did the price dip?"
3. Visual Representation The result of this calculation is displayed as a histogram in a separate window on your chart.
- When the distance between the low price and the moving average increases, the bars on the histogram grow taller.
- When the price stays close to the moving average, the bars remain small.
Summary for Traders
In simple terms, this indicator helps you visualize "downward pressure" or the intensity of a dip. By looking at the histogram, you can see how aggressively the price is pulling away from its recent average. It provides a visual measurement of the gap between where the price is and where it usually trades, allowing for a clearer perspective on market volatility and price extremes.
//+------------------------------------------------------------------+
//|                                                        Bears.mq4 |
//|                      Copyright © 2005, MetaQuotes Software Corp. |
//|                                       http://www.metaquotes.net/ |
//+------------------------------------------------------------------+
#property copyright "Copyright © 2005, MetaQuotes Software Corp."
#property link      "http://www.metaquotes.net/"

#property indicator_separate_window
#property indicator_buffers 1
#property indicator_color1 Silver
//---- input parameters
extern int BearsPeriod=13;
//---- buffers
double BearsBuffer[];
double TempBuffer[];
//+------------------------------------------------------------------+
//| Custom indicator initialization function                         |
//+------------------------------------------------------------------+
int init()
  {
   string short_name;
//---- 1 additional buffer used for counting.
   IndicatorBuffers(2);
   IndicatorDigits(Digits);
//---- indicator line
   SetIndexStyle(0,DRAW_HISTOGRAM);
   SetIndexBuffer(0,BearsBuffer);
   SetIndexBuffer(1,TempBuffer);
//---- name for DataWindow and indicator subwindow label
   short_name="Bears("+BearsPeriod+")";
   IndicatorShortName(short_name);
   SetIndexLabel(0,short_name);
//----
   return(0);
  }
//+------------------------------------------------------------------+
//| Bears Power                                                      |
//+------------------------------------------------------------------+
int start()
  {
   int i,counted_bars=IndicatorCounted();
//----
   if(Bars<=BearsPeriod) return(0);
//----
   int limit=Bars-counted_bars;
   if(counted_bars>0) limit++;
   for(i=0; i<limit; i++)
      TempBuffer[i]=iMA(NULL,0,BearsPeriod,0,MODE_EMA,PRICE_CLOSE,i);
//----
   i=Bars-counted_bars-1;
   while(i>=0)
     {
      BearsBuffer[i]=Low[i]-TempBuffer[i];
      i--;
     }
//----
   return(0);
  }
//+------------------------------------------------------------------+
Comments