BB_RSI_v2_AlertEmail
Download script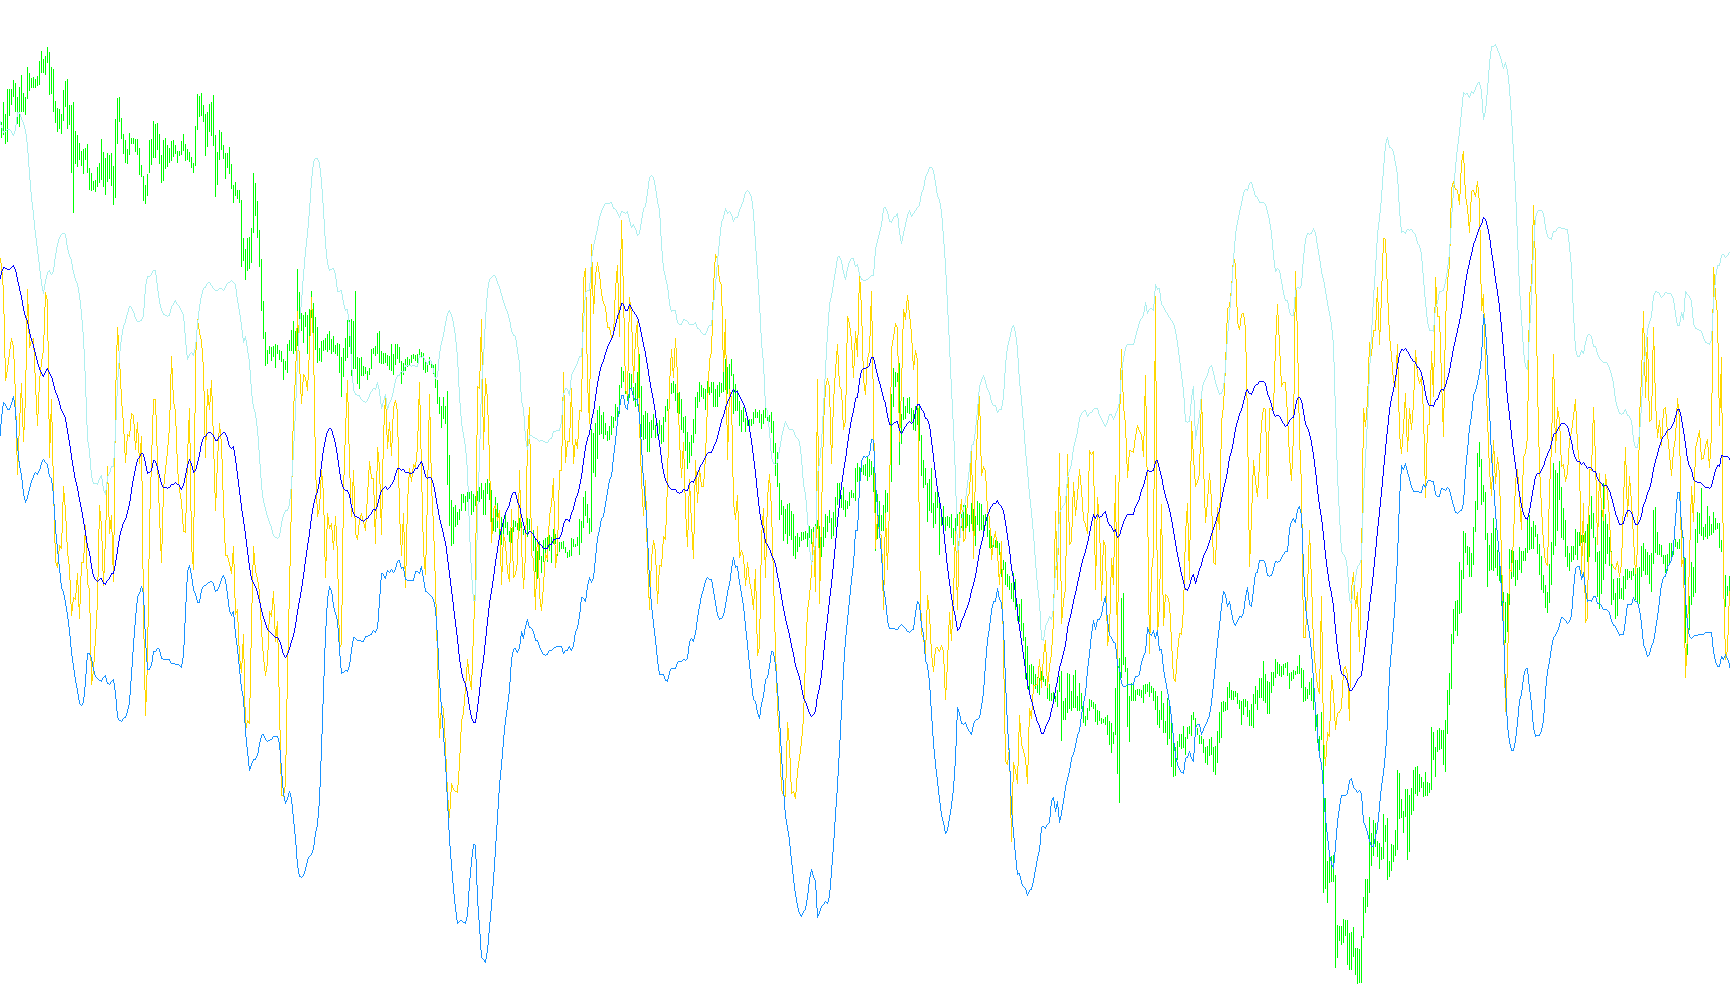
This tool is a sophisticated technical analysis indicator designed to help traders identify potential trend reversals by combining two well-known market metrics: the Relative Strength Index (RSI) and Bollinger Bands. By merging these two methods, the script aims to provide a clearer picture of whether an asset is being overbought or oversold compared to standard indicators used in isolation.
Core Logic and Functionality
The indicator operates through a three-step processing logic:
1. Calculating Momentum (RSI) The first layer of the logic calculates the "Relative Strength Index." This measures the speed and change of price movements. It looks at the average gains versus the average losses over a specific period (defaulting to 14 bars). The resulting value tells the trader how much upward or downward pressure is currently driving the market.
2. Applying Volatility Envelopes (Bollinger Bands) Rather than looking at the RSI value by itself, the script applies Bollinger Bands directly onto the RSI data. Bollinger Bands are typically used to measure volatility; they create a dynamic "channel" or "envelope" around a moving average. In this specific tool, these bands move with the RSI, creating upper and lower boundaries that adjust automatically based on how much the market is fluctuating.
3. Identifying Extremes (Overbought/Oversold Signals) The primary purpose of this script is to detect "extreme" conditions.
- Overbought: When the RSI line pushes above the upper Bollinger Band, it suggests the asset may have climbed too quickly and could be due for a correction or pullback.
- Oversold: When the RSI line drops below the lower Bollinger Band, it suggests the asset may have fallen too far and could be reaching a point where a bounce-back is likely.
Automated Notifications
Beyond simply drawing lines on a chart, the script includes an automated alert system. It monitors the live price action to see if the RSI breaks through these calculated boundaries. If a significant move occurs (verified by active trading volume), the script can automatically trigger:
- On-Screen Alerts: A pop-up box appears immediately on your trading platform.
- Email Notifications: An automated email is sent to your registered account, allowing you to stay updated on market signals even when you are away from your computer.
Summary for the User
Instead of just telling you if a price is "high" or "low," this script tells you if the current momentum is unusually high or low relative to recent volatility. It filters out standard market noise to highlight specific moments where the market might be overextended, helping traders make more informed decisions on potential entry and exit points.
//+------------------------------------------------------------------+
//|                                                       SMARSI.mq4 |
//|                          Typical RSI revised By TrendLaboratory  |
//|            http://finance.groups.yahoo.com/group/TrendLaboratory |
//|                                       E-mail: igorad2004@list.ru |
//+------------------------------------------------------------------+
// Added E-mail Alert by Trader101@optonline.net

#property copyright "Copyright © 2005, TrendLaboratory Ltd."
#property link      "http://finance.groups.yahoo.com/group/TrendLaboratory"

#property indicator_separate_window
#property indicator_minimum 0
#property indicator_maximum 100
#property indicator_level1 30
#property indicator_level2 50
#property indicator_level3 70
#property indicator_levelcolor DarkSlateGray

#property indicator_buffers 4
#property indicator_color1 DodgerBlue
#property indicator_color2 Yellow
#property indicator_color3 Yellow
#property indicator_color4 Yellow

//---- input parameters
extern int RSIPeriod=14;
extern int BBPeriod=20;
extern int Price=0;
extern int Deviation=2;
extern bool EmailAlert = true; //Added for E-mail Alert purpose
extern bool BoxAlert = true;


//---- buffers
double RSIBuffer[];
double BBBuffer[];
double UpBuffer[];
double DnBuffer[];

double PosBuffer[];
double NegBuffer[];
datetime TimeStamp; //Added for E-mail Alert purpose
//+------------------------------------------------------------------+
//| Custom indicator initialization function                         |
//+------------------------------------------------------------------+
int init()
  {
   string short_name;
//---- 2 additional buffers are used for counting.
   IndicatorBuffers(6);
   SetIndexBuffer(4,PosBuffer);
   SetIndexBuffer(5,NegBuffer);
//---- indicator line
   SetIndexStyle(0,DRAW_LINE);
   SetIndexBuffer(0,RSIBuffer);
   SetIndexStyle(1,DRAW_LINE);
   SetIndexBuffer(1,BBBuffer);
   SetIndexStyle(2,DRAW_LINE);
   SetIndexBuffer(2,UpBuffer);
   SetIndexStyle(3,DRAW_LINE);
   SetIndexBuffer(3,DnBuffer);


//---- name for DataWindow and indicator subwindow label
   short_name="BBRSI("+RSIPeriod+","+BBPeriod+","+Price+","+Deviation+")";
   IndicatorShortName(short_name);
   SetIndexLabel(0,short_name);
   SetIndexLabel(1,"BB mid");
   SetIndexLabel(2,"BB up");
   SetIndexLabel(3,"BB down");

//----
   SetIndexDrawBegin(0,RSIPeriod+BBPeriod);
   SetIndexDrawBegin(1,RSIPeriod+BBPeriod);
   SetIndexDrawBegin(2,RSIPeriod+BBPeriod);
   SetIndexDrawBegin(3,RSIPeriod+BBPeriod);


//----
   return(0);
  }
//+------------------------------------------------------------------+
//| BB and Relative Strength Index                                          |
//+------------------------------------------------------------------+
int start()
  {
   int    i,counted_bars=IndicatorCounted();
   double rel,negative,positive;
//----
   if(Bars<=RSIPeriod) return(0);
//---- initial zero
   if(counted_bars<1)
      for(i=1;i<=RSIPeriod;i++) RSIBuffer[Bars-i]=0.0;
//----
   i=Bars-RSIPeriod-1;
   if(counted_bars>=RSIPeriod) i=Bars-counted_bars-1;
   int MAPeriod=1;
   while(i>=0)
     {
      double sumn=0.0,sump=0.0;
      for (int k=RSIPeriod-1;k>=0;k--)
           {
            rel=iMA(NULL,0,MAPeriod,0,MODE_SMA,Price,i+k)-iMA(NULL,0,MAPeriod,0,MODE_SMA,Price,i+k+1);
            if(rel>0) sump+=rel;
            else      sumn-=rel;
           }
         positive=sump/RSIPeriod;
         negative=sumn/RSIPeriod;

      PosBuffer[i]=positive;
      NegBuffer[i]=negative;
      if(negative==0.0) RSIBuffer[i]=0.0;
      else RSIBuffer[i]=100.0-100.0/(1+positive/negative);

      i--;
     }
     int total=0;
     for (i=Bars-RSIPeriod-BBPeriod-1;i>=0;i--)
     {
     UpBuffer[i]=iBandsOnArray(RSIBuffer,total,BBPeriod,2,0,MODE_UPPER,i);
     DnBuffer[i]=iBandsOnArray(RSIBuffer,total,BBPeriod,2,0,MODE_LOWER,i);
     BBBuffer[i]=0.5*(UpBuffer[i]+DnBuffer[i]);
     }
//----
   //--------------Added for E-mail Alert----------------------
    double Rsi1  = RSIBuffer[1];
    double BBUp1 = UpBuffer[1];
    double BBDn1 = DnBuffer[1];
    string alertmessage = "BBRSI Alert " +Symbol()+" chart M"+Period()+" signal: ";
      if (Rsi1 > BBUp1  && TimeStamp != Time[0]&& Volume[0]>1)
        {
      alertmessage = (alertmessage +" OverBought");
      if (EmailAlert)   SendMail (alertmessage,"");
      if (BoxAlert)     Alert    (alertmessage);
         TimeStamp = Time[0];
         }
      if (Rsi1 < BBDn1 && TimeStamp != Time[0]&& Volume[0]>1)
         {
      alertmessage = alertmessage+" OverSold";

      if (EmailAlert)      SendMail (alertmessage,"");
      if (BoxAlert)        Alert    (alertmessage);
          TimeStamp = Time[0];
          }
   //--------------Added for E-mail Alert----------------------

   return(0);
  }
//+------------------------------------------------------------------+
Comments