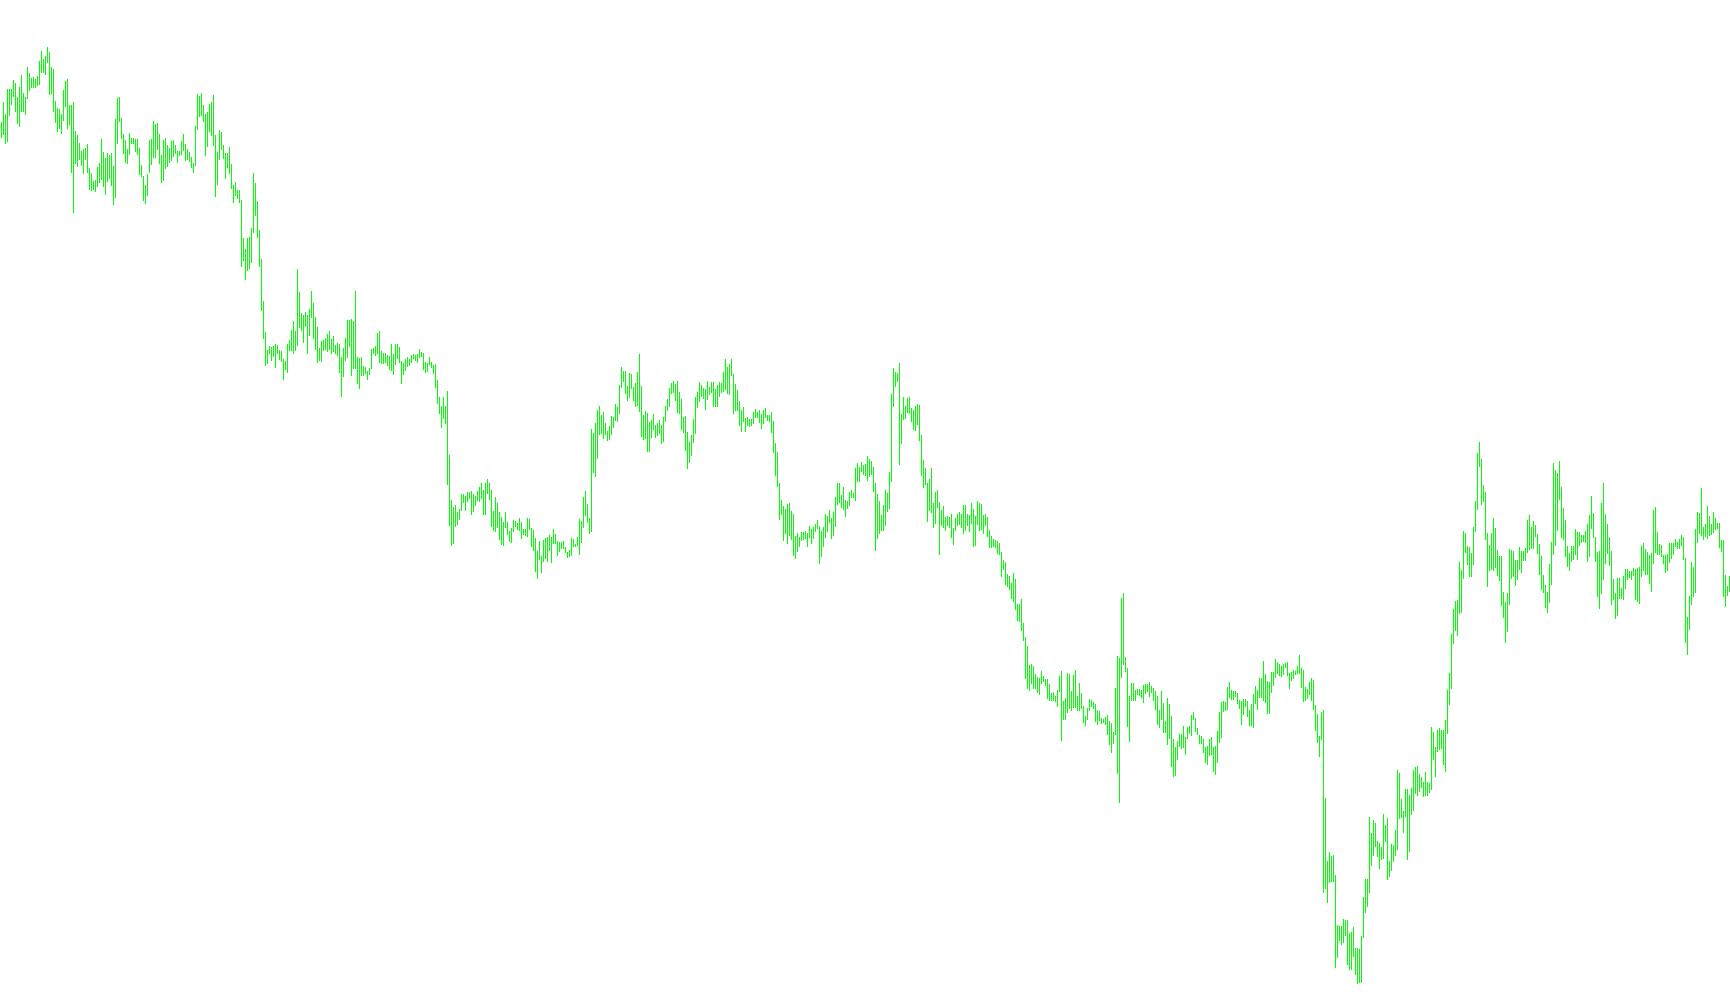
This tool is designed as a specialized visual indicator for the MetaTrader platform that helps traders visualize market trends by consolidating data from multiple timeframes simultaneously. Instead of requiring you to switch back and forth between different charts (such as 5-minute, 1-hour, and 4-hour views), this script automatically gathers and displays key moving average information in a single window.
How the Logic Works
The core functionality of this script relies on Multi-Timeframe Analysis. Here is the step-by-step breakdown of how it processes data:
- Time Synchronization: The script looks at the current price chart and identifies the specific point in time for each historical bar. It then "looks back" into different timeframes (specifically the 5-minute, 1-hour, and 4-hour periods) to find the corresponding bars for those exact moments.
- Moving Average Calculation: Once it identifies the correct points on the larger timeframes, it calculates three distinct Simple Moving Averages (SMA) for each. It specifically targets different "lengths" (short, medium, and long windows) to gauge how the price is behaving over various durations.
- Data Filtering: While the script performs calculations for all three major timeframes (5-minute, 1-hour, and 4-hour), it focuses its final visual output on the 1-hour timeframe.
- Visual Output: It takes the results from the 1-hour moving averages and plots them as three distinct lines on your screen. This allows you to see the "health" of the 1-hour trend instantly while you are looking at a smaller, more detailed price chart.
Summary for the User
Essentially, this script acts as a bridge. It performs the heavy lifting of scanning higher timeframes in the background and presents that information to you as clean, readable lines. This helps you stay aware of the "big picture" market direction without losing sight of the immediate price action on your current chart.
//+------------------------------------------------------------------+
//|                                                   Better_MA.mq4  |
//|                      Copyright © 2007, MetaQuotes Software Corp. |
//|                                        http://www.metaquotes.net |
//+------------------------------------------------------------------+
#property copyright "Copyright © 2007, MetaQuotes Software Corp."
#property link      "http://www.metaquotes.net"

#property indicator_separate_window
#property indicator_buffers 3
#property indicator_color1 Lime
#property indicator_color2 Aqua
#property indicator_color3 White


extern int NrBars=1000;

string SymbolName;
int PeriodMinutes1=0;
int PeriodMinutes5=PERIOD_M5;
int PeriodMinutes60=PERIOD_H1;
int PeriodMinutes240=PERIOD_H4;


//---- buffers
double VolBuffer1[];
double VolBuffer2[];
double VolBuffer3[];
double x0,x1,x2,x3,x4,x5,x6,x7,x8,x9;

//+------------------------------------------------------------------+
//| Custom indicator initialization function                         |
//|------------------------------------------------------------------|

int init()
  {


    SymbolName = Symbol();


   IndicatorBuffers(3);

   SetIndexStyle(0,DRAW_LINE,0,1);
   SetIndexBuffer(0, VolBuffer1);

   SetIndexEmptyValue(0,EMPTY_VALUE);

   SetIndexStyle(1,DRAW_LINE,0,1);
   SetIndexBuffer(1, VolBuffer2);

   SetIndexEmptyValue(1,EMPTY_VALUE);

   SetIndexStyle(2,DRAW_LINE,0,1);
   SetIndexBuffer(2, VolBuffer3);

   SetIndexEmptyValue(2,EMPTY_VALUE);

   return(0);
  }


//+------------------------------------------------------------------+
//| Custor indicator deinitialization function                       |
//+------------------------------------------------------------------+
int deinit()
  {

  }

//+------------------------------------------------------------------+
//| Custom indicator iteration function                              |
//+------------------------------------------------------------------+
int start()
  {

   for (int i=NrBars-1;i>=0;i--)
      {
      datetime time1=iTime(SymbolName,PeriodMinutes1,i);

      int b5=iBarShift(SymbolName,PeriodMinutes5,time1,true);
      int b60=iBarShift(SymbolName,PeriodMinutes60,time1,true);
      int b240=iBarShift(SymbolName,PeriodMinutes240,time1,true);


      if(b5>=0)
      {
        x0=iClose(SymbolName,PeriodMinutes5,b5);
        x1=iMA(SymbolName,PeriodMinutes5,5,0,MODE_SMA,PRICE_CLOSE,b5+2);
        x2=iMA(SymbolName,PeriodMinutes5,10,0,MODE_SMA,PRICE_CLOSE,b5+2);
        x3=iMA(SymbolName,PeriodMinutes5,15,0,MODE_SMA,PRICE_CLOSE,b5+2);
      }
      if(b60>=0)
      {
        x4=iMA(SymbolName,PeriodMinutes60,5,0,MODE_SMA,PRICE_CLOSE,b60+2);
        x5=iMA(SymbolName,PeriodMinutes60,10,0,MODE_SMA,PRICE_CLOSE,b60+2);
        x6=iMA(SymbolName,PeriodMinutes60,15,0,MODE_SMA,PRICE_CLOSE,b60+2);
      }
      if(b240>=0)
      {
        x7=iMA(SymbolName,PeriodMinutes240,5,0,MODE_SMA,PRICE_CLOSE,b240+2);
        x8=iMA(SymbolName,PeriodMinutes240,10,0,MODE_SMA,PRICE_CLOSE,b240+2);
        x9=iMA(SymbolName,PeriodMinutes240,15,0,MODE_SMA,PRICE_CLOSE,b240+2);
      }
	  VolBuffer1[i]=x4;
 	  VolBuffer2[i]=x5;
 	  VolBuffer3[i]=x6;

  }


   return(0);
  }
//+------------------------------------------------------------------+
Comments