Better_H1_1
Download script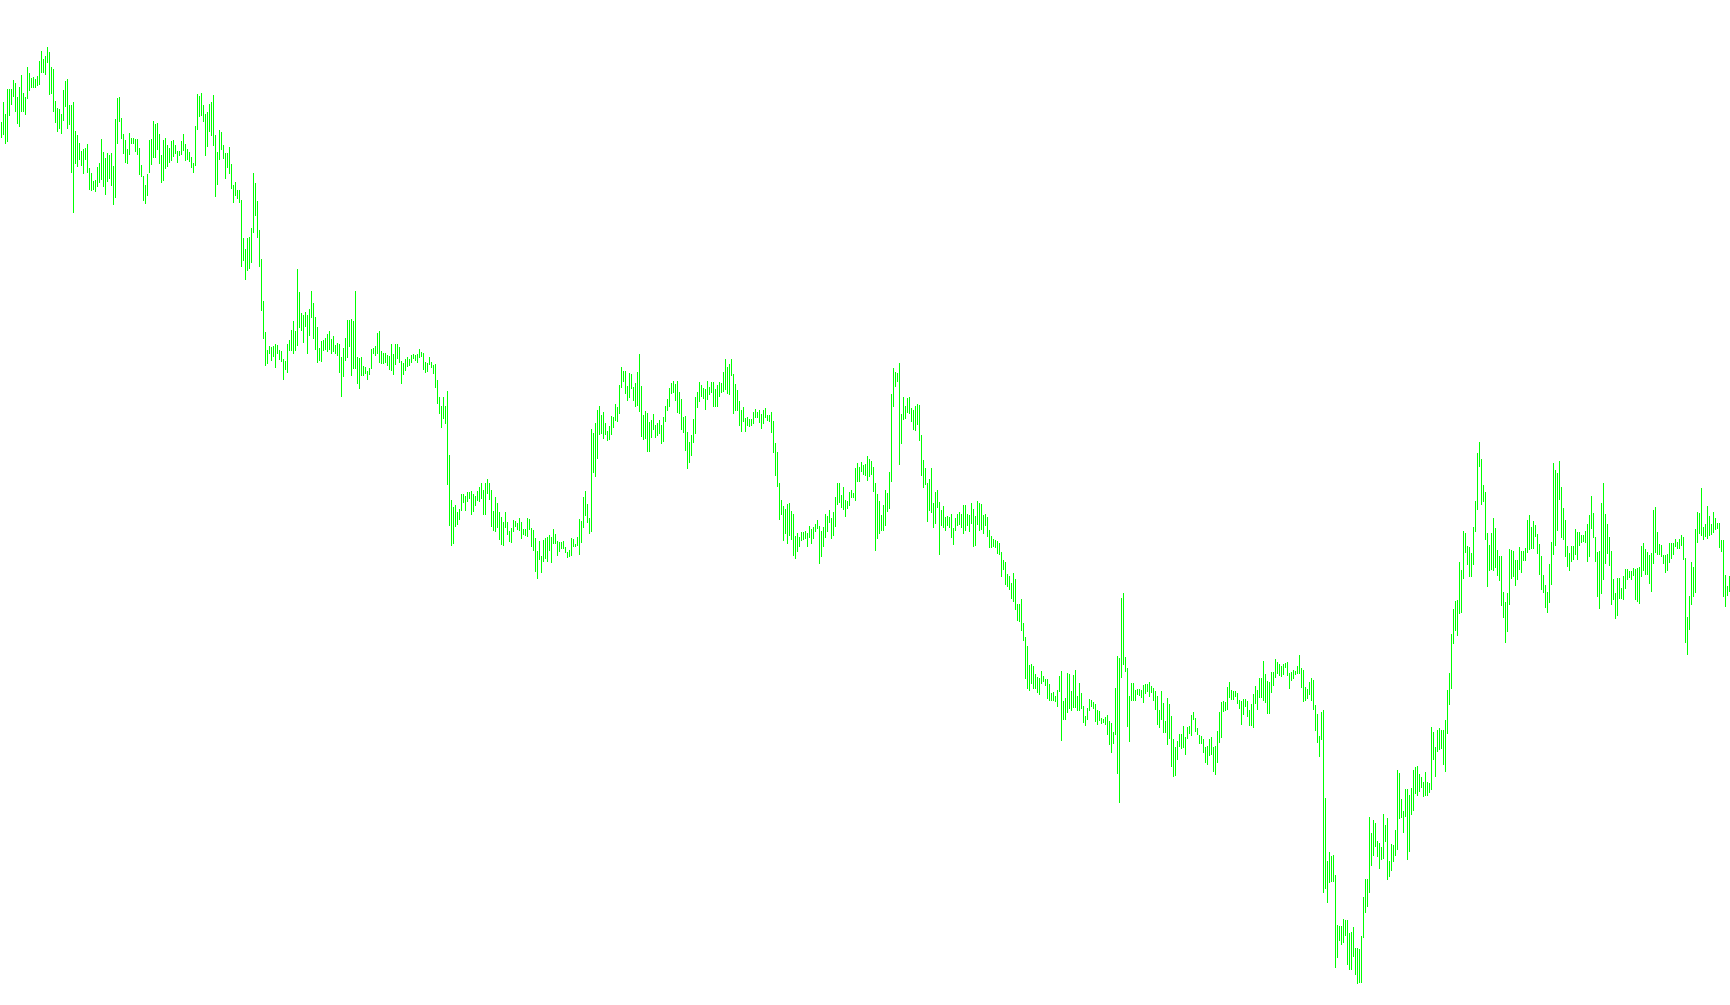
This tool is designed to provide traders with a multi-timeframe perspective of market trends by analyzing price movements across different intervals simultaneously. Instead of looking at just one chart, the script "looks ahead" into larger timeframes to help identify broader market directions that might be hidden on a smaller, more volatile timeframe.
Core Logic and Functionality
The primary objective of this script is to synthesize data from three distinct periods—5 minutes, 1 hour, and 4 hours—and project their moving average trends onto your current view. Here is how the logic flows:
1. Multi-Timeframe Synchronization The script identifies the specific point in time for each historical bar on your current chart. It then "shifts" those timestamps to find the corresponding candles on the 5-minute, 60-minute (1 hour), and 240-minute (4 hour) charts. This ensures that the data being displayed is perfectly aligned with the current price action you are watching.
2. Data Collection and Calculation For each of these three timeframes, the script calculates specific Moving Averages (MA). It looks specifically at the closing prices of previous candles to determine:
- Short-term momentum (based on a 5-period average)
- Medium-term trends (based on a 10-period average)
- Longer-term stability (based on a 15-period average)
3. Visual Output While the script gathers data from all three timeframes, it specifically filters and displays the results of the 60-minute (1 hour) timeframe. It plots three distinct lines in a separate window:
- The first line represents the 5-period moving average of the 1-hour chart.
- The second line represents the 10-period moving average of the 1-hour chart.
- The third line represents the 15-period moving average of the 1-hour chart.
Summary for the Trader
By using this script, you are essentially viewing a "smoothed" version of the 1-hour trend directly on your current chart. Rather than having to switch tabs or windows constantly to see what the hourly trend is doing, this tool provides that information automatically. It allows you to see if the current price is moving in harmony with the larger hourly market trends, providing a clearer picture of where the "big money" might be heading.
//+------------------------------------------------------------------+
//|                                                   Better_MA.mq4  |
//|                      Copyright © 2007, MetaQuotes Software Corp. |
//|                                        http://www.metaquotes.net |
//+------------------------------------------------------------------+
#property copyright "Copyright © 2007, MetaQuotes Software Corp."
#property link      "http://www.metaquotes.net"

#property indicator_separate_window
#property indicator_buffers 3
#property indicator_color1 Lime
#property indicator_color2 Aqua
#property indicator_color3 White


extern int NrBars=1000;

string SymbolName;
int PeriodMinutes1=0;
int PeriodMinutes5=PERIOD_M5;
int PeriodMinutes60=PERIOD_H1;
int PeriodMinutes240=PERIOD_H4;


//---- buffers
double VolBuffer1[];
double VolBuffer2[];
double VolBuffer3[];
double x0,x1,x2,x3,x4,x5,x6,x7,x8,x9;

//+------------------------------------------------------------------+
//| Custom indicator initialization function                         |
//|------------------------------------------------------------------|

int init()
  {


    SymbolName = Symbol();


   IndicatorBuffers(3);

   SetIndexStyle(0,DRAW_LINE,0,1);
   SetIndexBuffer(0, VolBuffer1);

   SetIndexEmptyValue(0,EMPTY_VALUE);

   SetIndexStyle(1,DRAW_LINE,0,1);
   SetIndexBuffer(1, VolBuffer2);

   SetIndexEmptyValue(1,EMPTY_VALUE);

   SetIndexStyle(2,DRAW_LINE,0,1);
   SetIndexBuffer(2, VolBuffer3);

   SetIndexEmptyValue(2,EMPTY_VALUE);

   return(0);
  }


//+------------------------------------------------------------------+
//| Custor indicator deinitialization function                       |
//+------------------------------------------------------------------+
int deinit()
  {

  }

//+------------------------------------------------------------------+
//| Custom indicator iteration function                              |
//+------------------------------------------------------------------+
int start()
  {

   for (int i=NrBars-1;i>=0;i--)
      {
      datetime time1=iTime(SymbolName,PeriodMinutes1,i);

      int b5=iBarShift(SymbolName,PeriodMinutes5,time1,true);
      int b60=iBarShift(SymbolName,PeriodMinutes60,time1,true);
      int b240=iBarShift(SymbolName,PeriodMinutes240,time1,true);


      if(b5>=0)
      {
        x0=iClose(SymbolName,PeriodMinutes5,b5);
        x1=iMA(SymbolName,PeriodMinutes5,5,0,MODE_SMA,PRICE_CLOSE,b5+1);
        x2=iMA(SymbolName,PeriodMinutes5,10,0,MODE_SMA,PRICE_CLOSE,b5+1);
        x3=iMA(SymbolName,PeriodMinutes5,15,0,MODE_SMA,PRICE_CLOSE,b5+1);
      }
      if(b60>=0)
      {
        x4=iMA(SymbolName,PeriodMinutes60,5,0,MODE_SMA,PRICE_CLOSE,b60+1);
        x5=iMA(SymbolName,PeriodMinutes60,10,0,MODE_SMA,PRICE_CLOSE,b60+1);
        x6=iMA(SymbolName,PeriodMinutes60,15,0,MODE_SMA,PRICE_CLOSE,b60+1);
      }
      if(b240>=0)
      {
        x7=iMA(SymbolName,PeriodMinutes240,5,0,MODE_SMA,PRICE_CLOSE,b240+1);
        x8=iMA(SymbolName,PeriodMinutes240,10,0,MODE_SMA,PRICE_CLOSE,b240+1);
        x9=iMA(SymbolName,PeriodMinutes240,15,0,MODE_SMA,PRICE_CLOSE,b240+1);
      }
	  VolBuffer1[i]=x4;
 	  VolBuffer2[i]=x5;
 	  VolBuffer3[i]=x6;

  }


   return(0);
  }
//+------------------------------------------------------------------+
Comments