BDFXtrender
Download script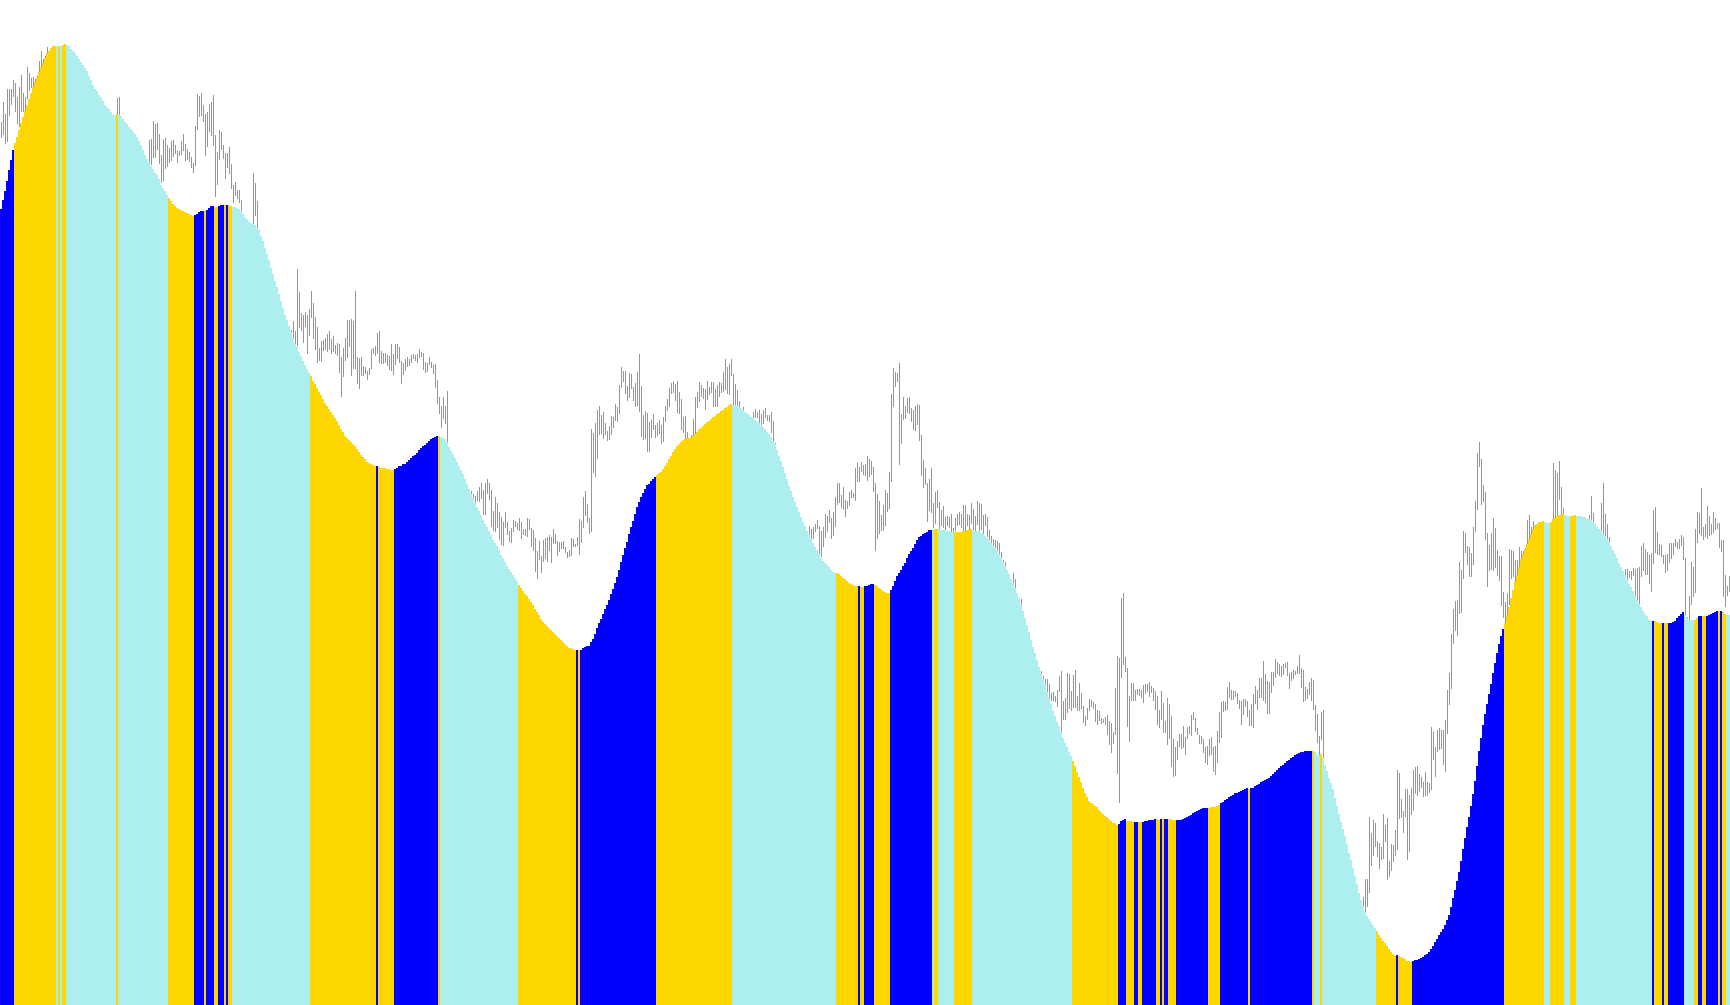
The BDFX Trendender is a technical analysis tool designed to help traders visualize the underlying momentum and direction of market price movements. Rather than simply following the raw price action, this indicator uses mathematical smoothing and weighted calculations to filter out "market noise," providing a clearer picture of the prevailing trend.
How the Logic Works
The core functionality of this script can be broken down into three primary stages:
1. Weighted Price Aggregation The indicator begins by analyzing historical price data over a specific window (defined by the user's settings). Instead of treating every price point equally, it applies a weighted calculation to the closing prices. By giving different importance to different segments of this time window, the tool creates a "weighted average" that identifies where the true center of gravity for the price is moving.
2. Trend Smoothing and Normalization Once the weighted values are calculated, the script processes them into a smoothed trend line. This step is crucial because it prevents the indicator from reacting too violently to minor, insignificant price fluctuations. It stabilizes the data so that only consistent, sustained movements in the market are highlighted as significant trends.
3. Signal Identification and Filtering The final layer of logic compares the smoothed trend against a secondary moving average. By checking the relationship between the current trend value, its previous value, and this secondary average, the indicator determines the "strength" of the move.
- Bullish/Bearish Dynamics: The tool looks for specific conditions where the trend is moving in harmony with its average.
- Visual Filtering: The script uses a specific logic to "hide" or nullify signals that do not meet these strict criteria. This ensures that the visual output on your chart remains clean, only showing relevant data points when a significant directional trend is confirmed.
Summary for the Trader
In essence, the BDFX Trendender acts as a sophisticated filter. It takes messy, fluctuating market data, weighs it to find the primary direction, smoothes out the distractions, and then validates those moves against an average. The result is a visual guide that helps you distinguish between temporary price spikes and genuine, sustained trend shifts.
// ------------------------------------------------------------------------------------------ //
//                     B D F X T R E N D E R   I N D I C A T O R                              //
//                          by fosgate_r    © January 2009                                    //
//                      URL : http://forexfreeea.blogspot.com/                                //
// ------------------------------------------------------------------------------------------ //


#property copyright "© January 2009 fosgate_r"
#property link "http://forexfreeea.blogspot.com/"
#property indicator_separate_window
#property indicator_buffers 3
#property indicator_color1 Gold
#property indicator_color2 Blue
#property indicator_color3 Red


// ------------------------------------------------------------------------------------------ //
//                            I N T E R N A L   V A R I A B L E S                             //
// ------------------------------------------------------------------------------------------ //

double Space1[], Space2[], Space3[], Space4[], Space5[], Drun, B2;
int    Count = 100, Vx1,Vx2 ,i;


// ------------------------------------------------------------------------------------------ //
//                             I N I T I A L I S A T I O N                                    //
// ------------------------------------------------------------------------------------------ //

int init()
{
   IndicatorBuffers (5);
   SetIndexBuffer (2,Space1);
   SetIndexBuffer (1,Space2);
   SetIndexBuffer (0,Space3);
   SetIndexBuffer (3,Space4);
   SetIndexBuffer (4,Space5);
   SetIndexStyle  (2,DRAW_HISTOGRAM,STYLE_SOLID,2);
   SetIndexStyle  (1,DRAW_HISTOGRAM,STYLE_SOLID,2);
   SetIndexStyle  (0,DRAW_HISTOGRAM,STYLE_SOLID,2);
   return(0);
}


// ------------------------------------------------------------------------------------------ //
//                                M A I N   P R O C E D U R E                                 //
// ------------------------------------------------------------------------------------------ //

int start()
{
   Vx1 = Count;
   i   = ((((Bars-Count)-5)-Vx1)-1);

   while (i >= 0)
   {
      Space4[1] = 0;
      Vx2       = Vx1;
      while (Vx2 >= 1)
      {
         Drun      = 0;
         Space4[1] = (Space4[1] + ((Vx2-((Vx1+1)*0.333333)) * Close[((Vx1-Vx2)+i)]));
         Vx2       = Vx2-1;
      }

      Space5[i] = ((Space4[1]*6)/(Vx1*(Vx1+1)));
      B2        = iMA(0,0,7,0,MODE_EMA,PRICE_TYPICAL,i);
      Space3[i] = Space5[i];
      Space2[i] = Space5[i];
      Space1[i] = Space5[i];

      if (((Space5[(i+1)]>Space5[i]) && (Space5[i]>B2)) == 1)  Space2[i] = 2147483647;
      else
      {  if (((Space5[(i+1)]<Space5[i]) && (Space5[i]<B2))==1) Space1[i] = 2147483647;
         else  {  Space1[i] = 2147483647; Space2[i] = 2147483647;  }
      }
      i = i-1;
   }
   return(0);
}

// ------------------------------------------------------------------------------------------ //
//                               E N D   O F   I N D I C A T O R                              //
// ------------------------------------------------------------------------------------------ //
Comments