Bears_001
Download script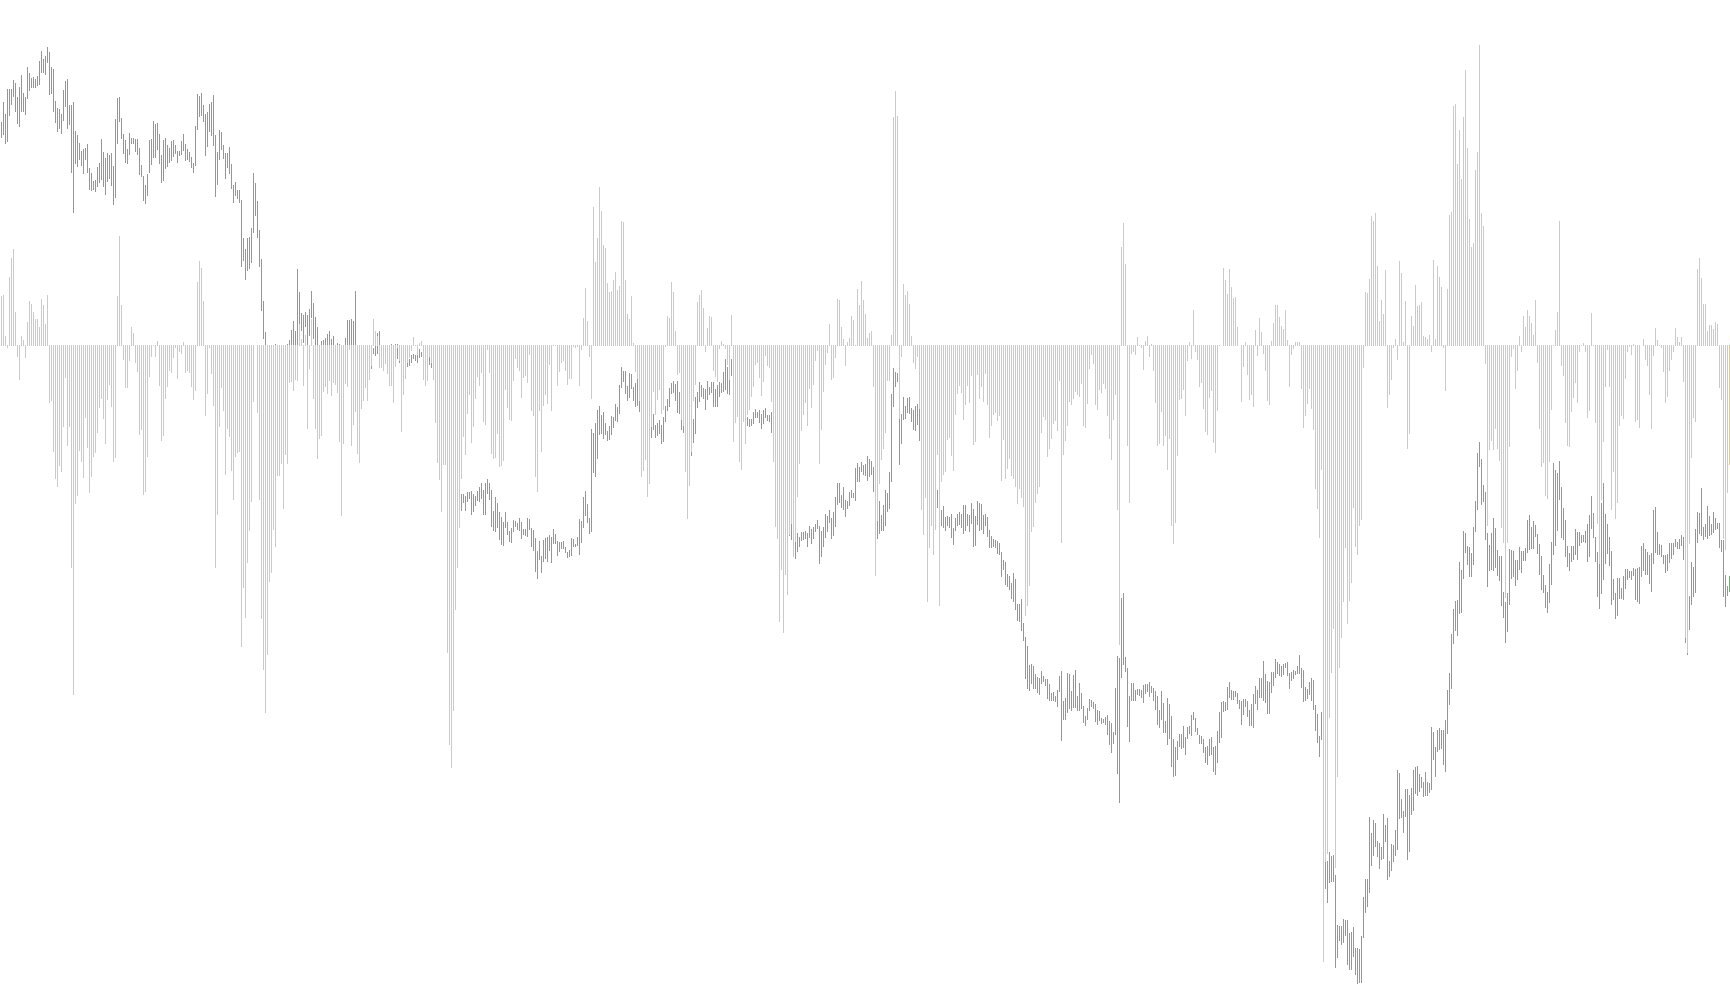
This tool is designed as a visual market indicator for the MetaTrader platform, specifically created to help traders identify price movements by measuring the distance between actual market prices and a calculated moving average.
Instead of appearing directly on the main price chart, this indicator creates its own dedicated window at the bottom of the screen. It displays a histogram, which allows you to see fluctuations in market momentum over time.
How it Works
The logic behind the tool follows a three-step process:
- Establishing a Baseline: The script looks at a specific number of previous price candles (which can be customized by the user) to calculate an Exponential Moving Average (EMA). This represents the "smoothed" trend of the market based on closing prices.
- Calculating the Gap: The tool then compares the current market "Low" (the lowest price reached during a specific timeframe) against that smoothed average. By subtracting the moving average value from the low price, the script determines how far the price is deviating from its recent trend.
- Visual Representation: This difference—the distance between the bottom of the price movement and the trend line—is plotted as a histogram.
Purpose for the Trader
By visualizing this gap, the tool helps users see where the market might be overextended or where there is significant pressure. When the histogram bars change in size, it signals to the trader that the relationship between the current price and the established trend is shifting, providing a visual cue for potential market activity.
//+------------------------------------------------------------------+
//|                                                        Bears.mq4 |
//|                      Copyright © 2005, MetaQuotes Software Corp. |
//|                                       http://www.metaquotes.net/ |
//+------------------------------------------------------------------+
#property copyright "Copyright © 2005, MetaQuotes Software Corp."
#property link      "http://www.metaquotes.net/"

#property indicator_separate_window
#property indicator_buffers 1
#property indicator_color1 Silver
//---- input parameters
extern int BearsPeriod=13;
//---- buffers
double BearsBuffer[];
double TempBuffer[];
//+------------------------------------------------------------------+
//| Custom indicator initialization function                         |
//+------------------------------------------------------------------+
int init()
  {
   string short_name;
//---- 1 additional buffer used for counting.
   IndicatorBuffers(2);
   IndicatorDigits(Digits);
//---- indicator line
   SetIndexStyle(0,DRAW_HISTOGRAM);
   SetIndexBuffer(0,BearsBuffer);
   SetIndexBuffer(1,TempBuffer);
//---- name for DataWindow and indicator subwindow label
   short_name="Bears("+BearsPeriod+")";
   IndicatorShortName(short_name);
   SetIndexLabel(0,short_name);
//----
   return(0);
  }
//+------------------------------------------------------------------+
//| Bears Power                                                      |
//+------------------------------------------------------------------+
int start()
  {
   int i,counted_bars=IndicatorCounted();
//----
   if(Bars<=BearsPeriod) return(0);
//----
   int limit=Bars-counted_bars;
   if(counted_bars>0) limit++;
   for(i=0; i<limit; i++)
      TempBuffer[i]=iMA(NULL,0,BearsPeriod,0,MODE_EMA,PRICE_CLOSE,i);
//----
   i=Bars-counted_bars-1;
   while(i>=0)
     {
      BearsBuffer[i]=Low[i]-TempBuffer[i];
      i--;
     }

   if(i<1)
   Print("ALERTDOO");
   if(i==1)
   Print("equal sifnnncn");
   if(i>1)
   Print("not good");


//----
   return(0);
  }
//+------------------------------------------------------------------+
Comments