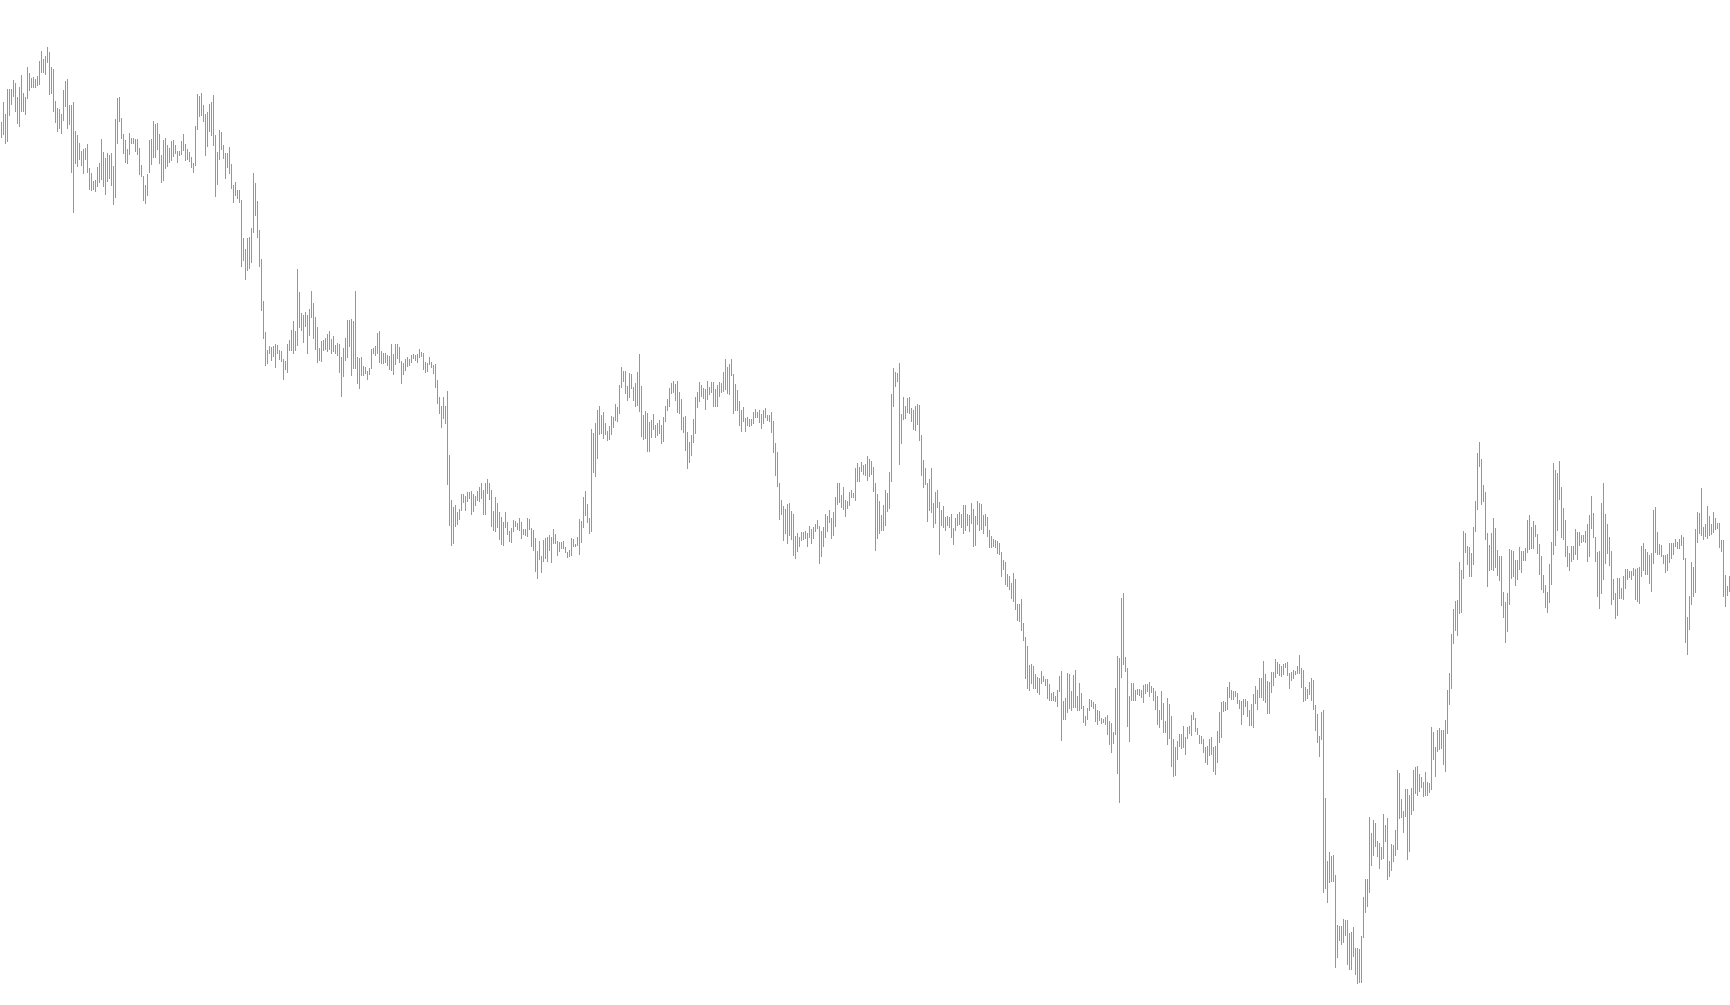
This tool is designed to provide a visual overlay on your trading charts, helping to identify specific types of high-intensity price action based on volume and volatility. Instead of just showing raw volume as a separate bar at the bottom of the screen, this script analyzes the relationship between price movement (the "range") and the amount of trading activity (the "volume") to highlight significant market behaviors directly on the candles.
Core Logic Overview
The indicator works by looking at a specific window of past data (defined by the LookBack setting) to determine what constitutes an extraordinary event in the current market environment. It essentially compares the current candle against its recent neighbors to see if it represents a peak in activity or a unique exhaustion point.
How it Identifies Market Behavior
The logic evaluates the price action using two primary calculations:
- Intensity Measurement: It calculates the "weight" of a candle by multiplying the volume by the price range. This helps identify candles where a large amount of money moved the price significantly.
- Efficiency Measurement: Conversely, it also divides the volume by the price range. This identifies situations where a high amount of trading occurred but resulted in very little price movement (often indicating heavy resistance or "churn").
Visual Signals and Interpretations
Based on these calculations, the script highlights specific scenarios using different colors:
- High-Intensity Upward Movement (Red/Blue): When the tool detects a peak in intensity (where significant volume met a wide price range) and the price closed in the upper half of the candle, it marks this as a "Climax High." This suggests a strong, aggressive push by buyers.
- High-Intensity Downward Movement (White/Magenta): If the tool detects that same peak intensity but the price closed in the lower half of the candle, it identifies a "Climax Low," indicating aggressive selling pressure.
- Low Volume / High Efficiency (Yellow/Green): The script also identifies candles with notably low volume relative to recent history, provided they aren't part of an extreme efficiency spike. This can help highlight periods of relative market apathy or "thin" trading.
Summary for the Trader
Rather than cluttering your screen with standard volume bars, this script acts as a filter. It scans the price history and automatically paints the chart to show you exactly where the "climaxes" occurred—the moments of maximum effort by both buyers and sellers—allowing you to spot potential trend reversals or exhaustion points more clearly at a glance.
#property copyright ""
#property link      ""

#property indicator_chart_window
#property indicator_buffers 6
#property indicator_color1 Red
#property indicator_color2 Red
#property indicator_color3 Yellow
#property indicator_color4 Yellow
#property indicator_color5 White
#property indicator_color6 White
#property indicator_width1 2
#property indicator_width2 2
#property indicator_width3 2
#property indicator_width4 2
#property indicator_width5 2
#property indicator_width6 2


extern int     NumberOfBars = 500;
extern string  Note = "0 means Display all bars";
extern int     MAPeriod = 100;
extern int     LookBack = 20;


double red[],blue[],yellow[],green[],white[],magenta[];
//+------------------------------------------------------------------+
//| Custom indicator initialization function                         |
//+------------------------------------------------------------------+
int init()
  {
//---- indicators
      SetIndexBuffer(0,red);
      SetIndexStyle(0,DRAW_HISTOGRAM);
      SetIndexLabel(0,"Climax High ");

      SetIndexBuffer(1,blue);
      SetIndexStyle(1,DRAW_HISTOGRAM);
      SetIndexLabel(1,"");

      SetIndexBuffer(2,yellow);
      SetIndexStyle(2,DRAW_HISTOGRAM);
      SetIndexLabel(2,"Low ");

      SetIndexBuffer(3,green);
      SetIndexStyle(3,DRAW_HISTOGRAM);
      SetIndexLabel(3,"");

      SetIndexBuffer(4,white);
      SetIndexStyle(4,DRAW_HISTOGRAM);
      SetIndexLabel(4,"Climax Low ");

      SetIndexBuffer(5,magenta);
      SetIndexStyle(5,DRAW_HISTOGRAM);
      SetIndexLabel(5,"");

      IndicatorShortName("Better Volume On Chart 1.4" );


//----
   return(0);
  }
//+------------------------------------------------------------------+
//| Custom indicator deinitialization function                       |
//+------------------------------------------------------------------+
int deinit()
  {
//----

//----
   return(0);
  }
//+------------------------------------------------------------------+
//| Custom indicator iteration function                              |
//+------------------------------------------------------------------+
int start()
  {

   double VolLowest,Range,Value2,Value3,HiValue2,HiValue3,LoValue3,tempv2,tempv3,tempv;
   int limit;
   int counted_bars=IndicatorCounted();
//---- last counted bar will be recounted
   if(counted_bars>0) counted_bars--;
   if ( NumberOfBars == 0 )
      NumberOfBars = Bars-counted_bars;
   limit=NumberOfBars; //Bars-counted_bars;


   for(int i=0; i<limit; i++)
      {
         red[i] = 0; blue[i] = 0; yellow[i] = 0; green[i] = 0; white[i] = 0; magenta[i] = 0;
         Value2=0;Value3=0;HiValue2=0;HiValue3=0;LoValue3=99999999;tempv2=0;tempv3=0;tempv=0;


         Range = (High[i]-Low[i])/Point;
         Value2 = Volume[i]*Range;

         if (  Range != 0 )
            Value3 = Volume[i]/Range;

         for ( int n=i;n<i+LookBack;n++)
            {
               tempv2 = Volume[n]*((High[n]-Low[n])/Point);
               if ( tempv2 > HiValue2 )
                  HiValue2 = tempv2;


               if ( Volume[n]*((High[n]-Low[n])/Point) != 0 )
                  {
                     tempv3 = Volume[n] / ((High[n]-Low[n])/Point);
                     if ( tempv3 > HiValue3 )
                        HiValue3 = tempv3;
                     if ( tempv3 <  LoValue3 )
                        LoValue3 = tempv3;
                  }
            }


          if ( Value2 == HiValue2 && Close[i] > (High[i] + Low[i]) / 2 )
            {
               red[i] = High[i];
               blue[i]=Low[i];
               //yellow[i]=0;
            }

          if ( Value3 == HiValue3 )
            {
               //green[i] = High[i];
               //blue[i] =Low[i];
               //yellow[i]=0;
               //red[i]=0;
            }
         VolLowest = Volume[iLowest(NULL,0,MODE_VOLUME,20,i)];
         if (Volume[i] == VolLowest && Value3 != HiValue3)
            {
               yellow[i] = High[i];
               green[i]=Low[i];
            }
          if ( Value2 == HiValue2 && Value3 == HiValue3 )
            {
               //magenta[i] = High[i];
               //blue[i]=Low[i];
               //red[i]=0;
               //green[i]=0;
               //yellow[i]=0;
            }
          if ( Value2 == HiValue2 && Close[i] <= (High[i] + Low[i]) / 2 )
            {
               white[i] = High[i];
               magenta[i]=Low[i];
               //blue[i]=0;
               //red[i]=0;
               //green[i]=0;
               //yellow[i]=0;
            }


      }
//----

//----
   return(0);
  }
//+------------------------------------------------------------------+
Comments