mslmsh
Download script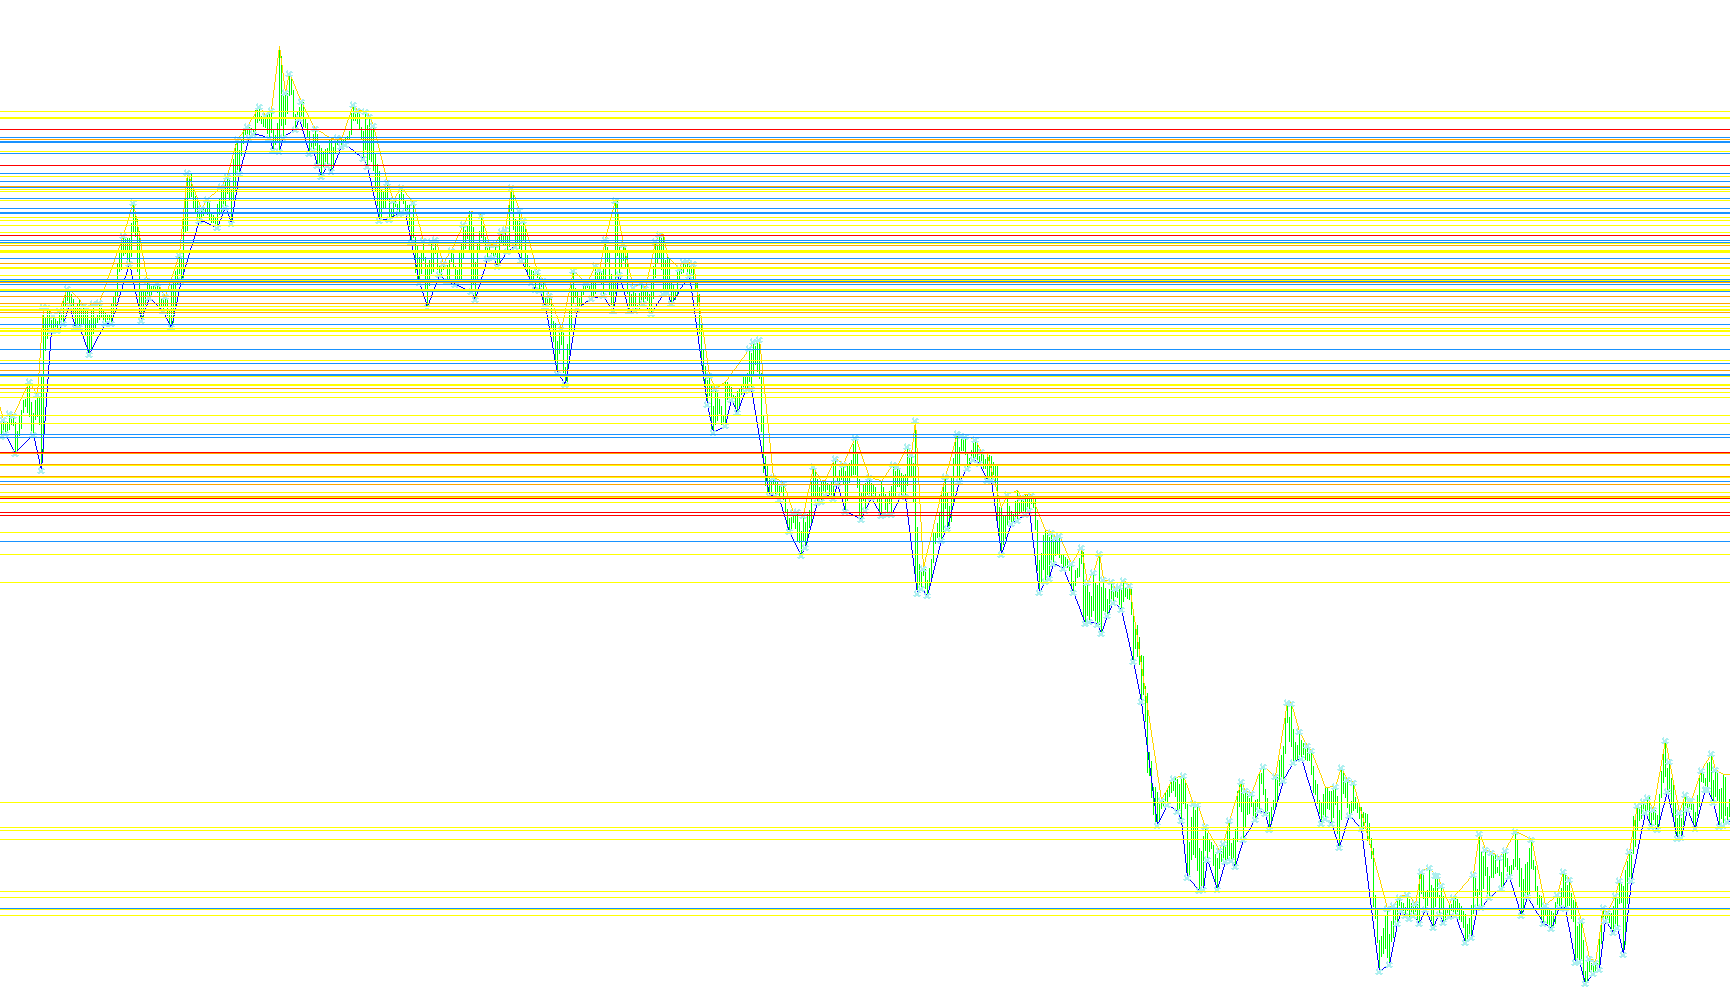
This script is designed to analyze historical price data to identify significant structural turning points in the market—specifically "Market Structure Lows." By analyzing the relationship between high and low prices over time, it filters out minor noise to highlight areas where the price movement has shown consistent resistance or support.
Core Logic Overview
The tool functions by scanning the entire price history of a chart to detect specific patterns where the market changes direction. It operates using three main phases:
1. Identification of Structural Points The script monitors every bar on the chart looking for "pivot" points.
- For Lows: It looks for instances where a previous low was higher than its surrounding neighbors, indicating a potential structural floor.
- For Highs: It identifies similar peaks where the price reached a specific local maximum before receding.
Once these points are identified, the script "registers" them into a database. Rather than treating every single point equally, it groups these prices based on their proximity to one another (using a user-defined range). This allows the script to see how often the price returns to a specific level.
2. Frequency and Significance Mapping This is the most sophisticated part of the logic. The tool calculates the "frequency" of each identified price level.
- If a specific price level is hit multiple times, the script recognizes it as a significant zone.
- It then establishes a threshold based on a user-defined percentage (the "Porcent" variable). Only price levels that have been touched frequently enough to meet this significance threshold are highlighted.
3. Visual Representation and Heat Mapping Once the significant levels are confirmed, the script draws horizontal lines across the chart to visualize these zones. To help the user interpret the data at a glance, it applies a color-coding system:
- Weighting: The more frequently a price level is touched, the "heavier" its significance.
- Color Coding: Different colors are assigned based on this frequency. This creates a visual hierarchy where users can immediately distinguish between a "minor" structural point and a "major" high-traffic price zone.
Summary for the User
In simple terms, this script acts as a high-traffic map for price levels. It looks at all the historical peaks and valleys, figures out which specific prices are visited most often by the market, and draws colored lines on your chart to show you where the "crowded" structural zones are located. This helps in identifying areas where the market is likely to react based on historical repetition.
//+------------------------------------------------------------------+
//|                                                          msh.mq4 |
//|                                 Copyright © 2010, Thomas Quester |
//| Market structure low / market structure low                      |
//|                                                  tquester@gmx.de |
//+------------------------------------------------------------------+
#property copyright "Copyright © 2010, Thomas Quester"
#property link      "tquester@gmx.de"

#property indicator_chart_window
#property indicator_buffers 4
#property indicator_color1 Red
#property indicator_color2 Red
#property indicator_color3 Yellow
#property indicator_color4 Yellow
//---- buffers
extern int PipRange=5;
extern int Porcent=20;
double ExtMapBuffer1[];
double ExtMapBuffer2[];
double ExtMapBuffer3[];
double ExtMapBuffer4[];
int    counter[];
double index[];
int    count;
int    colors[] = {White,Yellow,DodgerBlue,Orange,Red};


int       maxcount;
//+------------------------------------------------------------------+
//| Custom indicator initialization function                         |
//+------------------------------------------------------------------+
void clearIndex()
{
   ArrayResize(counter,Bars);
   ArrayResize(index,Bars);
   count =0;
   maxcount=0;
   ArrayInitialize(counter,0);
   ArrayInitialize(index,0);
}

// adds a price to the price arry
// we calculate the price in pips/10
void addPrice(double price)
{
   int i;
   bool found = false;
   int pips = price/Point;
   pips/=PipRange;
   pips*=PipRange;

   for (i=0;i<count;i++)
   {
      if (index[i] == pips)
      {
         found = true;
         counter[i] = counter[i]+1;
         if (counter[i] > maxcount)
             maxcount = counter[i];

         break;
      }
   }
   if (!found)
   {
      index[count] = pips;
      counter[i] = 1;
      count++;
   }
}
int init()
  {
//---- indicators
   SetIndexStyle(0,DRAW_LINE);
   SetIndexBuffer(0,ExtMapBuffer1);
   SetIndexStyle(1,DRAW_LINE);
   SetIndexBuffer(1,ExtMapBuffer2);
   SetIndexStyle(2,DRAW_ARROW);
   SetIndexBuffer(2,ExtMapBuffer3);
   SetIndexStyle(3,DRAW_ARROW);
   SetIndexBuffer(3,ExtMapBuffer4);
//----
   return(0);
  }
//+------------------------------------------------------------------+
//| Custom indicator deinitialization function                       |
//+------------------------------------------------------------------+
int deinit()
  {
//----

//----
   return(0);
  }

void clearLines()
{
    int i;
    string s;
    for (i=0;i<400;i++)
    {
        s = "----------line---------"+i;
        ObjectDelete(s);

    }
}

void createLines()
{
   int i;
   int id;
   int c;
   int w;
   double price;
   string name;
   int min = maxcount*Porcent;

   min /= 100;
   Print("maxcount="+maxcount+" min="+min);
   int range = maxcount- min;
   if (range<5)
      range=5;
   id = 0;
   for (i=0;i<count;i++)
   {
       if (counter[i] > min)
       {
           price = index[i] * Point;
           name = "----------line---------"+id;
           id=id+1;
           c  = counter[i];
           ObjectCreate(name,OBJ_HLINE,0,0,price);
           // maxcount=100
           // min=75
           // range 0..24
           // 24 soll 5 sein
           // 0  soll 1 sein
           w = c-min;


    //       w /= range/5;
    //       Print("price="+price+" w = "+w, " range="+range," maxcount="+ maxcount+" min="+min);


           ObjectSet(name,OBJPROP_COLOR,colors[w]);
           ObjectSetText(name,c + " points w="+w,10);
           if (id > 400) break;
       }
   }
}

//+------------------------------------------------------------------+
//| Custom indicator iteration function                              |
//+------------------------------------------------------------------+
int start()
  {
   int i,j,k,cnt;
   double a,b,c,
          d,e,f;
   int    counted_bars=IndicatorCounted();
   a = 0;
   b = 0;
   c = 0;
   clearIndex();
   for (i=Bars;i>=0;i--)
   {
     ExtMapBuffer1[i] = -1;
     ExtMapBuffer2[i] = -1;
     ExtMapBuffer3[i] = -1;
     ExtMapBuffer4[i] = -1;
     a = b;
     b = c;
     c = High[i];

     d = e;
     e = f;
     f = Low[i];


     if (a <= b && c <= b)
     {
         ExtMapBuffer1[i+1] = b;
         ExtMapBuffer3[i+1] = b;
         addPrice(b);
     }

     if (d >= e && f >= e)
     {
         ExtMapBuffer2[i+1] = e;
         ExtMapBuffer3[i+1] = e;
         addPrice(e);
     }

   }
//----
   //connect points with lines (interploating)
   a = 0;
   j = -1;
   for (i=Bars;i>=0;i--)
   {
      if (ExtMapBuffer1[i] != -1)
      {
         if (j != -1)
         {
            cnt = i-j;
            b = ExtMapBuffer1[i];
            c = (b-a)/cnt;
            for (k=i;k<j;k++)
            {
               ExtMapBuffer1[k] = b;
               b += c;
            }

         }
         j = i;
         a = ExtMapBuffer1[i];
      }
   }
   for (i=0;i<Bars;i++)
   {
      if (ExtMapBuffer1[i] != -1) break;
      ExtMapBuffer1[i] = a;
   }

   a = 0;
   j = -1;
   for (i=Bars;i>=0;i--)
   {
      if (ExtMapBuffer2[i] != -1)
      {
         if (j != -1)
         {
            cnt = i-j;
            b = ExtMapBuffer2[i];
            c = (b-a)/cnt;
            for (k=i;k<j;k++)
            {
               ExtMapBuffer2[k] = b;
               b += c;
            }

         }
         j = i;
         a = ExtMapBuffer2[i];
      }
   }
   for (i=0;i<Bars;i++)
   {
      if (ExtMapBuffer2[i] != -1) break;
      ExtMapBuffer2[i] = a;
   }

   clearLines();
   createLines();

//----
   return(0);
  }
//+------------------------------------------------------------------+
Comments