MTF Candles
Download script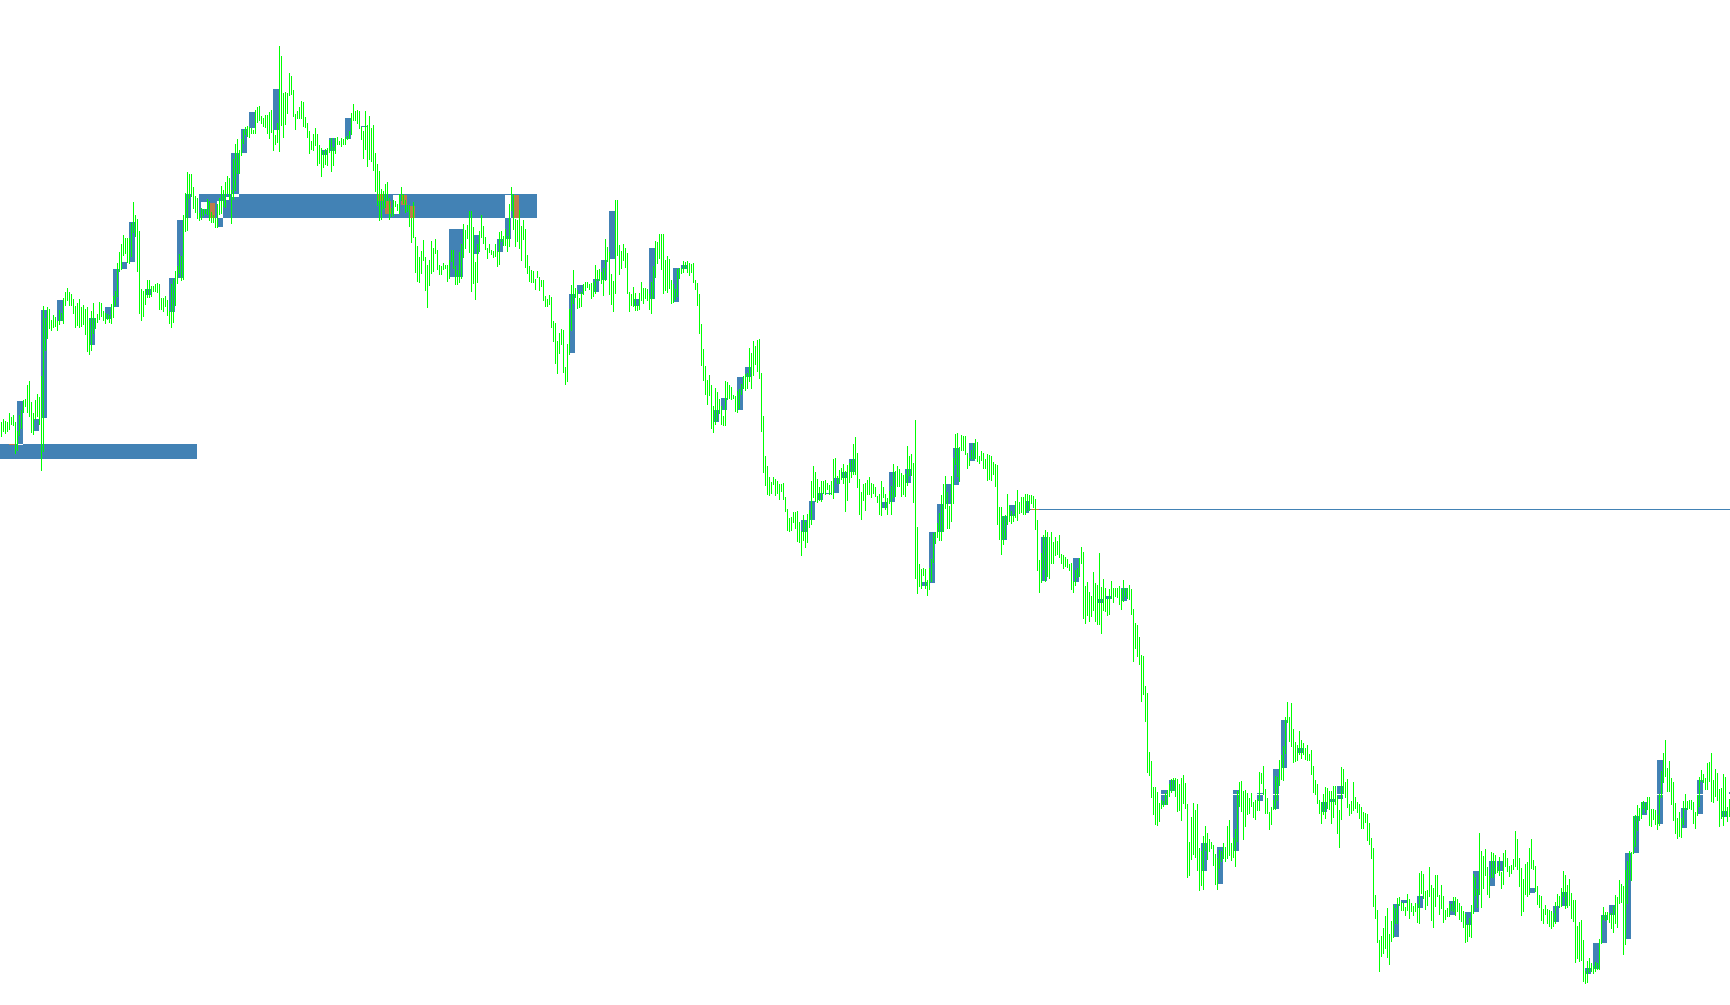
This tool is designed to provide a visual overlay on your trading charts, allowing you to view higher timeframe price action simultaneously with your current chart view. It simplifies the process of "multi-timeframe analysis" by automatically drawing representative candles from a larger time period onto your smaller, more active chart.
How it Works
The core logic of this script revolves around identifying and mapping data points between two different time scales (for example, viewing 4-hour candle data while looking at a 15-minute chart). Here is the step-by-step breakdown of that process:
- Timeframe Selection: The tool allows you to specify which higher timeframe you want to observe. It translates common market terms (like "H4" for 4 hours or "D1" for one day) into the specific number of minutes required to calculate those periods accurately.
- Data Synchronization: As the script scans your current chart, it looks for the corresponding starting point on the higher timeframe. It matches the opening price of the current candle to its equivalent position in the larger time period.
- Dynamic Drawing: Once a match is found, the tool creates a visual "block" or rectangle on your screen. These blocks represent the price movements of the larger candles.
- Real-Time Updates: The script is designed to be dynamic. As new price data comes in, it updates the height and position of these rectangles. This ensures that as the higher timeframe candle develops—whether it is moving up or down—the visual representation on your chart moves with it in real-time.
- Visual Coding: To make the information easy to read at a glance, the tool automatically changes the color of these visual blocks based on price action:
- It applies one color (Bullish) when the price is moving upward.
- It switches to a different color (Bearish) when the price is moving downward.
User Experience
Instead of having to constantly switch between different tabs or windows to see what the "big picture" looks like, this script brings that big picture directly to your current screen. It provides a clear, side-by-side visual of where the larger market trends are sitting in relation to your immediate trading actions, helping you stay aligned with the dominant market structure.
#property copyright "Copyright © 2009, Julien Loutre"
#property link      "http://www.zenhop.com"

#property  indicator_chart_window
#property  indicator_buffers 1
#property  indicator_color1  LightBlue
#property  indicator_width1 1

extern string timeframe = "H4";
extern color  BullColor = SteelBlue;
extern color  BearColor = White;

double      extBuffer[];

double open,close,open1,close1,high,low;
int p;
int currentCandle = 0;

int init() {
   IndicatorBuffers(1);
   SetIndexStyle(0,DRAW_NONE);
   SetIndexDrawBegin(0,0);
   SetIndexEmptyValue(0, 0.0);
   SetIndexBuffer(0,extBuffer);
   SetIndexLabel(0,"Open Price");
   IndicatorDigits(6);
   return(0);
}

int start() {
   int    counted_bars=IndicatorCounted();
   int    limit,i,j;
   double tmp;
   if(counted_bars>0) counted_bars--;
   limit=Bars-counted_bars;
   p = tfstrtoint(timeframe);
   for(i=limit-1; i>=0; i--) {
      int rp  = MathCeil(i*Period()/p);
      int rp1 = MathCeil((i+1)*Period()/p);
      for (j=i;j<=i+p/Period();j++) {
         if (iOpen(NULL,p,rp) == iOpen(NULL,0,i)) {
            open = iOpen(NULL,0,i);
            close = iClose(NULL,0,i);
            open1 = iOpen(NULL,p,rp1);
            close1 = iClose(NULL,p,rp1);
         }
      }
      extBuffer[i] = open;
      if (extBuffer[i] != extBuffer[i+1]) {
         currentCandle++;
         createCandle(Time[i],open);
      }
      updateCandle(Time[i],close1);
   }
   return(0);
}

void createCandle(double t, double o) {
   ObjectCreate("candle"+currentCandle,OBJ_RECTANGLE,0,t,o,t,o);
}
void updateCandle(double t, double c) {
   ObjectSet("candle"+currentCandle, OBJPROP_TIME2, t);
   ObjectSet("candle"+currentCandle, OBJPROP_PRICE2, c);
   if (ObjectGet("candle"+currentCandle, OBJPROP_PRICE1)>ObjectGet("candle"+currentCandle, OBJPROP_PRICE2)) {
      ObjectSet("candle"+currentCandle, OBJPROP_COLOR, BearColor);
   } else {
      ObjectSet("candle"+currentCandle, OBJPROP_COLOR, BullColor);
   }
}
void deleteCandles() {
   ObjectsDeleteAll(0, OBJ_RECTANGLE);
}
int deinit() {
   deleteCandles();
   return(0);
}
int tfstrtoint(string str) {
   if (str == "M1") {
      return(1);
   }
   if (str == "M5") {
      return(5);
   }
   if (str == "M15") {
      return(15);
   }
   if (str == "M30") {
      return(30);
   }
   if (str == "H1") {
      return(60);
   }
   if (str == "H4") {
      return(240);
   }
   if (str == "D1") {
      return(1440);
   }
   if (str == "W1") {
      return(10080);
   }
   if (str == "MN") {
      return(43200);
   }
   if (str == "") {
      return(0);
   }
}
Comments