maxminchannelwithslope
Download script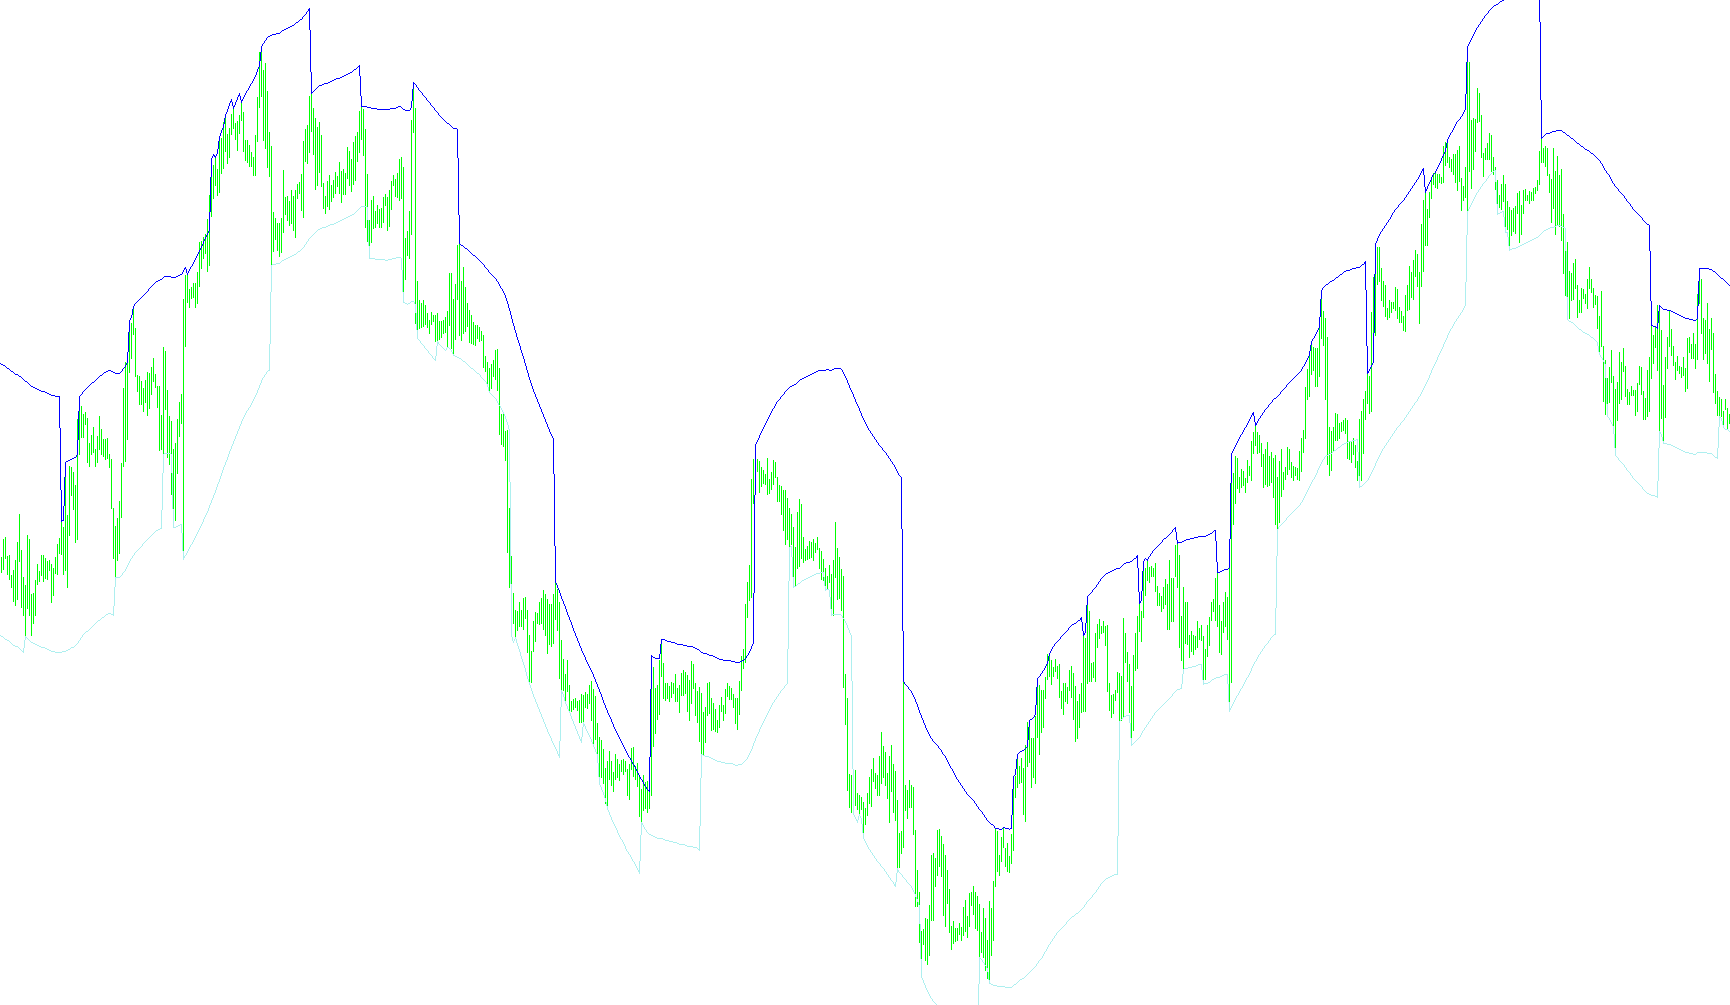
This tool is designed to help traders visualize price boundaries by creating a dynamic "channel" on a chart. Instead of using standard fixed moving averages, it identifies the highest and lowest price points over a specific period and projects them forward based on the prevailing momentum of the market.
How the Logic Works
The script operates through three primary logical steps to determine where the price boundaries should sit:
1. Identifying Historical Extremes The tool constantly looks back at a user-defined number of candles (bars). It identifies the absolute highest and lowest prices reached within that window. This provides the "anchor" for the channel, ensuring that the boundaries are rooted in actual recent market highs and lows.
2. Calculating Market Momentum (Slope) Rather than simply drawing flat horizontal lines, the script calculates a "slope." It analyzes the difference between the current price range (the distance between the high and low of a candle) and the previous price range. By comparing these movements over time, it determines whether the market is trending upwards, downwards, or staying neutral. This calculation acts as a mathematical "tilt" for the channel.
3. Projecting the Dynamic Channel Once the script knows where the recent highs/lows were and how much the price is tilting, it draws two distinct lines:
- The Upper Boundary: If the current candle hits a new high within the lookback period, the line anchors to that point. Otherwise, it projects forward based on the calculated slope.
- The Lower Boundary: Similarly, if the current candle hits a new low, the line anchors there; otherwise, it follows the projected slope.
Key Characteristics for the User
- Adaptive Boundaries: Because the channel is based on "slope," the lines will expand, contract, or tilt in real-time as market volatility and direction change.
- Dynamic Anchoring: The logic is "self-correcting." Whenever the price breaks out of the established range to form a new peak or valley, the anchor point resets, and the channel begins projecting from that new level.
- Visual Trend Guidance: The primary goal of this logic is to provide a visual representation of market "space." It helps traders see where the current price action is being contained and provides a mathematical forecast of where those boundaries might move next based on recent momentum.
//+------------------------------------------------------------------+
//|simple max - min channel with slope                               +
//+------------------------------------------------------------------+
#property copyright "fajuzi@yahoo.it 2015"
#property description "simple max - min channel with ema slope"
#property indicator_chart_window
#property indicator_buffers 3
//#property indicator_color1 Gold
#property indicator_color2 Blue
#property indicator_color3 Blue
//string short_name;
//--- external var
input int      barre=20;//bars for calculation min max
input double   ratio=4.0;//ratio ema period / bars
input double   xslope=1.0;//slope adjustment
//-----global var
double cosemap,emap,xslp,pendenzaxslp;
//---- buffers
double /*mediana[],*/pendenza[],bandasu[],bandaju[];
//+------------------------------------------------------------------+
//| Custom indicator initialization function                         |
//+------------------------------------------------------------------+
int init()
  {
   xslp=xslope*0.5;//adjustment of slope
   emap=barre*ratio;//period
   cosemap=(emap+1.0)/2.0;//constant
//---- indicators
   SetIndexStyle(1,DRAW_LINE,STYLE_SOLID);
   SetIndexStyle(2,DRAW_LINE,STYLE_SOLID);
//SetIndexStyle(3,DRAW_LINE,STYLE_SOLID);
   SetIndexBuffer(0,pendenza);
   SetIndexBuffer(1,bandasu);
   SetIndexBuffer(2,bandaju);
//SetIndexBuffer(3,mediana);
   IndicatorDigits(5);
   string short_name="donpen2("+IntegerToString(barre)+","+DoubleToString(ratio,2)+")";
   IndicatorShortName(short_name);
//SetIndexLabel(0,"middle");
   SetIndexLabel(1,"up");
   SetIndexLabel(2,"down");
   return(1);
  }
//+------------------------------------------------------------------+
//| Custom indicator iteration function                              |
//+------------------------------------------------------------------+
int start()
  {
   int pos=Bars-5;
   int counted_bars=IndicatorCounted();
//---- check for possible errors
   if(counted_bars<0) return(-1);
//---- last counted bar will be recounted
   if(counted_bars>0) pos=Bars-counted_bars-1;
   else
     {
      pendenza[pos+1]=0.0;
     }
   while(pos>=0)
     {
      pendenza[pos]=pendenza[pos+1]+(High[pos]+Low[pos]-High[pos+1]-Low[pos+1]-pendenza[pos+1])/cosemap;
      pendenzaxslp=pendenza[pos]*xslp;

      switch(pos+1-iHighest(Symbol(),Period(),MODE_HIGH,barre,pos))
        {
         case 0 : bandasu[pos+1]=High[pos+1]; break;
         default : bandasu[pos+1]=bandasu[pos+2]+pendenzaxslp;
        }
      switch(pos+1-iLowest(Symbol(),Period(),MODE_LOW,barre,pos))
        {
         case 0 : bandaju[pos+1]=Low[pos+1]; break;
         default : bandaju[pos+1]=bandaju[pos+2]+pendenzaxslp;
        }
      //mediana[pos+1]=(bandasu[pos+1]+bandaju[pos+1])*0.5;
      pos--;
     }
   bandasu[0]=bandasu[1]+pendenzaxslp;
   bandaju[0]=bandaju[1]+pendenzaxslp;
//mediana[0]=mediana[1]+pendenzaxslp;
//----
   return(0);
  }
//+------------------------------------------------------------------+
Comments