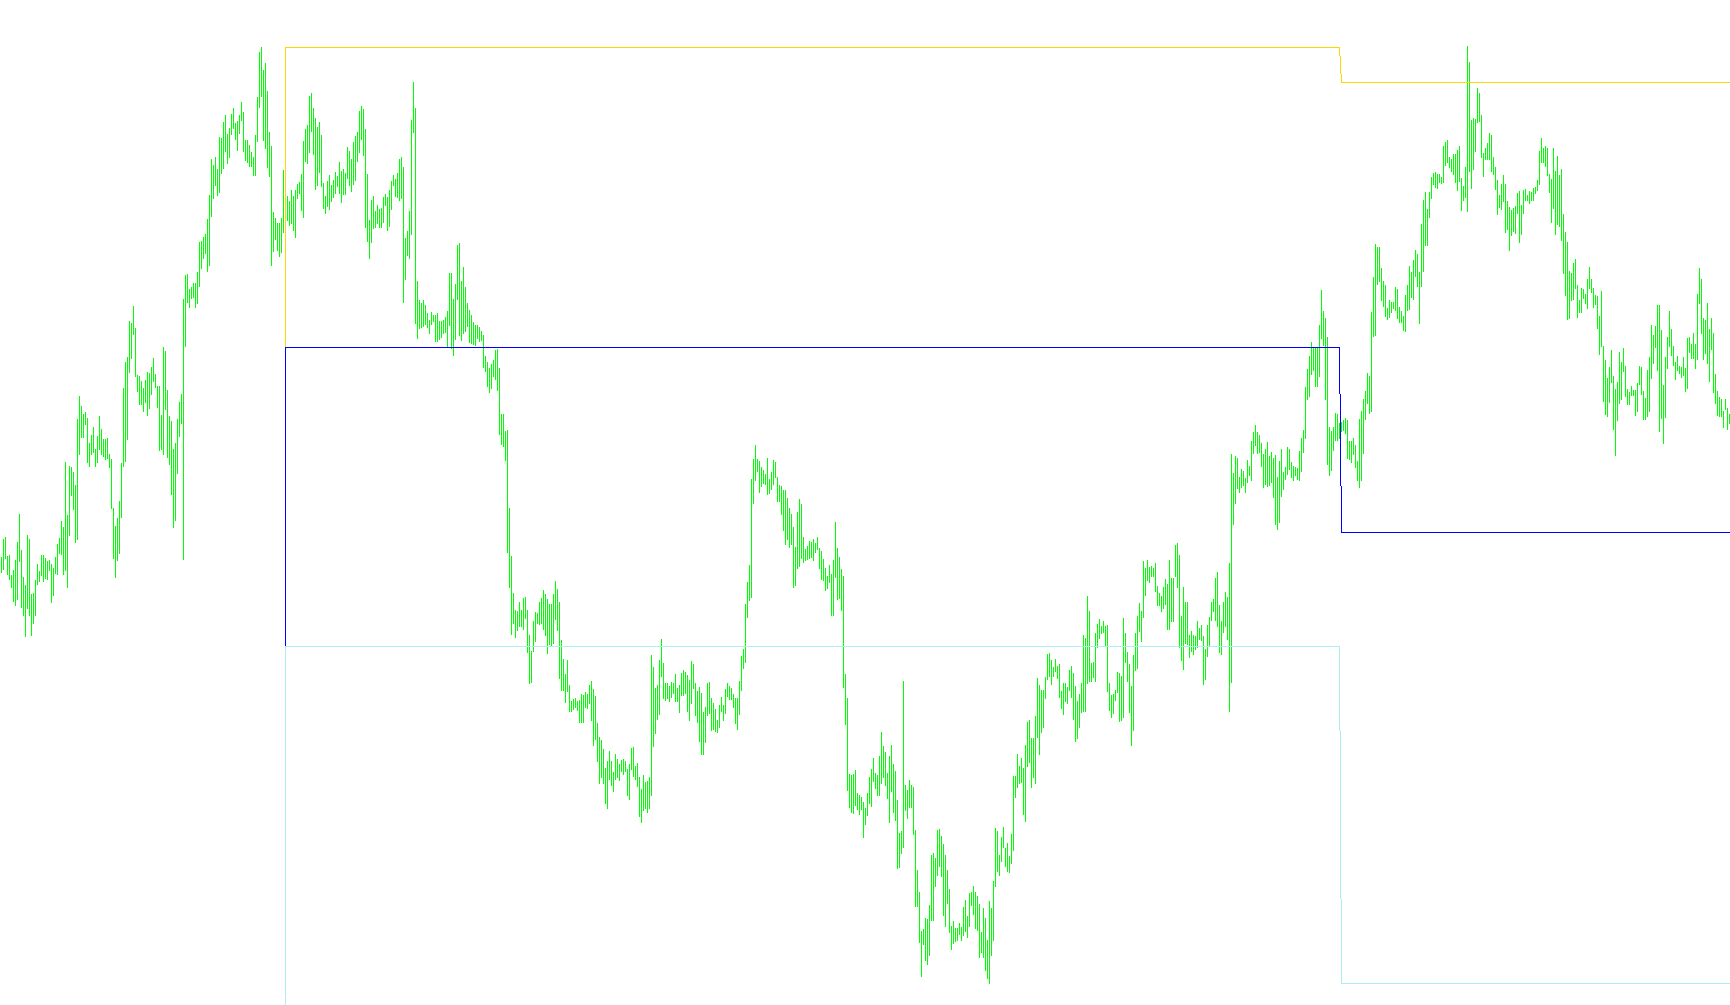
This tool is designed to help traders visualize key price levels based on previous daily market activity. It automatically calculates and plots important horizontal reference points on your chart, specifically focusing on the highest and lowest prices reached during previous trading sessions.
Core Functionality
The script scans historical price data to identify the "High" and "Low" extremes for each day. Once it identifies these boundaries, it performs three specific calculations to generate visual markers:
- Resistance Level: It identifies the highest price point reached during the previous day.
- Support Level: It identifies the lowest price point reached during the previous day.
- Midpoint (Pivot): It calculates the exact middle point between yesterday's high and low prices.
How it Works
Instead of just showing you a single number, the script draws three distinct lines on your chart:
- A Resistance Line representing the ceiling of yesterday's price action.
- A Support Line representing the floor of yesterday's price action.
- A Pivot Line representing the average (50% mark) of that daily range.
Key Features & User Controls
- Customizable Lookback: You can decide how far back into the past the script should look. You can set it to analyze the entire history of the chart or limit it to a specific number of recent bars.
- On-Screen Information: The tool includes an optional summary comment that stays on your screen. This provides you with a quick text readout of the current High, Low, Midpoint, and the total price distance (range) between the high and low for easy reference.
- Timeframe Safety: To ensure accuracy, the script is designed to work on intraday charts (any timeframe smaller than a month). It will alert you if you try to use it on an unsupported timeframe.
Practical Use
This tool simplifies technical analysis by automatically highlighting where "walls" and "floors" were created in previous trading days. By seeing these levels clearly marked, traders can better identify potential areas of price rejection or support during the current session.
//+------------------------------------------------------------------+
//| dayHL_Average.mq4 |
//+------------------------------------------------------------------+
/*
Name := dayHL_Average
Author := KCBT
Link := http://www.kcbt.ru/forum/index.php?
*/

#property indicator_chart_window
#property indicator_buffers 3
#property indicator_color1 Red
#property indicator_color3 Red
//---- input parameters5
extern int show_comment=1; // comments on the chart (0 - no, 1 - yes)
extern int how_long=1000; // bars to be counted (-1 - all the bars)
//---- indicator buffers
double ExtMapBuffer1[];
double ExtMapBuffer2[];
double ExtMapBuffer3[];

//+------------------------------------------------------------------+
//| Custom indicator initialization function |
//+------------------------------------------------------------------+
int init()
{
SetIndexBuffer(0, ExtMapBuffer1);
SetIndexStyle(0, DRAW_LINE);
SetIndexBuffer(1, ExtMapBuffer2);
SetIndexStyle(1, DRAW_LINE);
SetIndexBuffer(2, ExtMapBuffer3);
SetIndexStyle(2, DRAW_LINE);
return(0);
}

//+------------------------------------------------------------------+
//| Custom indicator deinitialization function |
//+------------------------------------------------------------------+
int deinit()
{
Comment("");
return(0);
}

int start()
{
int cnt=0; // ñ÷åò÷èê áàðîâ
int begin_bar=0; // áàð, ñ êîòîðîãî íà÷èíàåò ðàáîòó èíäèêàòîð
int prev_day, cur_day; // èäåíòèôèêàòîðû òåêóùåãî è ïðåäûäóùåãî äíÿ
double day_high=0; // äíåâíîé high
double day_low=0; // äíåâíîé low
double yesterday_high=0; // íàèáîëüøàÿ öåíà ïðåäûäóùåãî äíÿ
double yesterday_low=0; // íàèìåíüøàÿ öåíà ïðåäûäóùåãî äíÿ
double yesterday_close=0; // öåíà çàêðûòèÿ ïðåäûäóùåãî äíÿ
double P, S, R;

// ïðàâèëüíûå òàéìôðåìû äëÿ íàøåãî èíäèêàòîðà - âñå, ÷òî ìåíüøå D1
if (Period() >= PERIOD_MN1) {
Comment("WARNING: Invalid timeframe! Valid value < MN1.");
return(0);
}

// ðåøàåì ñ êàêîãî áàðà ìû íà÷íåì ñ÷èòàòü íàø èíäèêàòîð
if (how_long == -1) {
begin_bar = Bars;
} else {
begin_bar = how_long;
}

// îáõîäèì áàðû ñëåâà íàïðàâî (0-é áàð òîæå èñïîëüçóåì, ò.ê. èç íåãî ìû áåð¸ì òîëüêî high è low)
for (cnt = begin_bar; cnt >= 0; cnt--) {
cur_day = TimeMonth(Time[cnt]);
if (prev_day != cur_day) {
yesterday_close = Close[cnt+1];
yesterday_high = day_high;
yesterday_low = day_low;
P = (yesterday_high + yesterday_low ) / 2;
R = yesterday_high;
S = yesterday_low;

// ò.ê. íà÷àëñÿ íîâûé äåíü, òî èíèöèèðóåì ìàêñ. è ìèí. òåêóùåãî (óæå) äíÿ
day_high = High[cnt];
day_low = Low[cnt];

// çàïîìíèì äàííûé äåíü, êàê òåêóùèé
prev_day = cur_day;
}

// ïðîäîëæàåì íàêàïëèâàòü äàííûå
day_high = MathMax(day_high, High[cnt]);
day_low = MathMin(day_low, Low[cnt]);

// ðèñóåì pivot-ëèíèþ ïî çíà÷åíèþ, âû÷èñëåííîìó ïî ïàðàìåòðàì â÷åðàøíåãî äíÿ
ExtMapBuffer2[cnt] = P;
// ðèñóåì ëèíèè ñîïðîòèâëåíèÿ è ïîääåðæêè óðîâíÿ 1,2 èëè 3
ExtMapBuffer1[cnt] = R; // ñîïðîòèâëåíèå
ExtMapBuffer3[cnt] = S; // ïîääåðæêà
}

if (show_comment == 1) {
P = (yesterday_high + yesterday_low ) / 2;
R = yesterday_high;
S = yesterday_low;

Comment("Current H=", R, ", L=", S, ", HL/2=", P, ", H-L=", (R-S)/Point );
}
return(0);
}
//+------------------------------------------------------------------+
Comments