mtf_bar_indicator_v1_0
Download script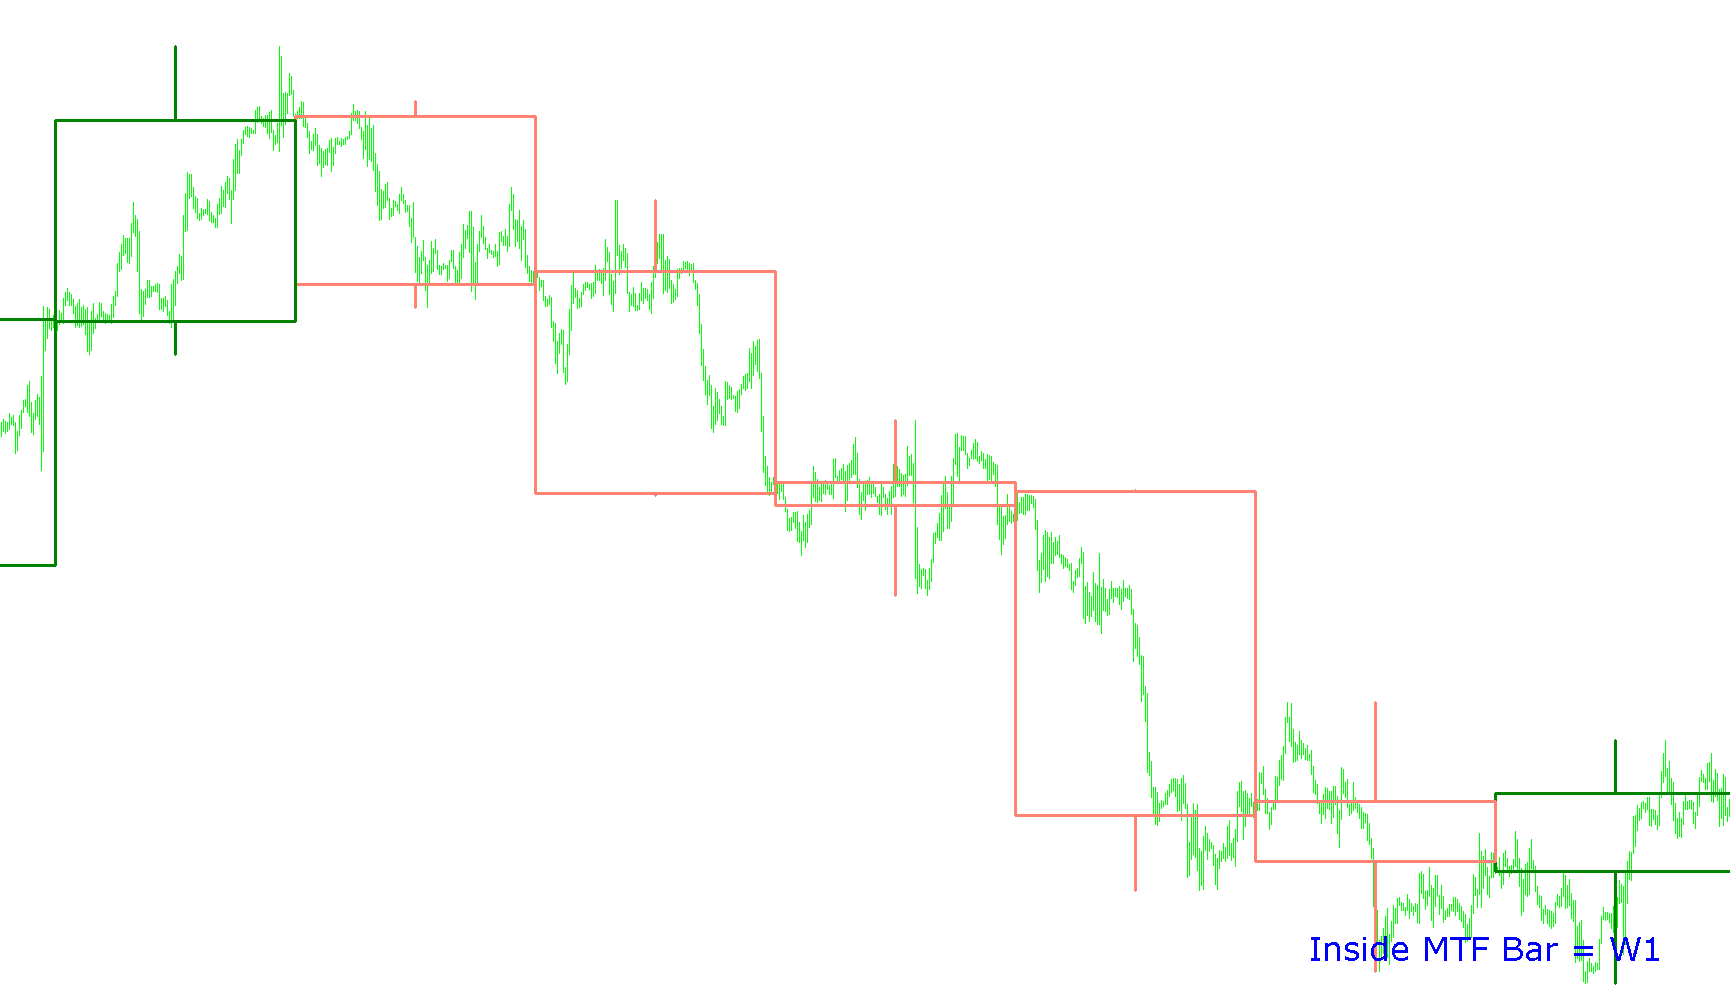
This script is designed to provide traders with a multi-timeframe visual analysis tool. Its primary purpose is to project and display price action data from a higher time interval onto your current chart, allowing you to see how larger trends and candles interact with the specific timeframe you are currently viewing.
Core Functionality
1. Multi-Timeframe Synchronization The logic automatically identifies a higher time interval based on your current view. If you are looking at a small timeframe (like 1 minute), it calculates which larger timeframe should be displayed to give you a broader perspective. It then pulls the price data from that larger period and maps it onto your screen.
2. Visual Mapping of "Inside" Bars The script identifies historical candles from the higher timeframe and draws them as distinct visual objects on your chart. Instead of just showing you a simple line, it creates a structured representation of those candles:
- Body Representation: It renders the main body of the higher timeframe candle (the space between the opening and closing prices).
- Wick/Range Representation: It highlights the high and low points of those candles.
- Color Coding: The script dynamically assigns colors—typically green for upward movements and salmon for downward movements—so you can instantly distinguish the direction of the higher timeframe's momentum.
3. Dynamic Labeling and Statistics To ensure clarity, the tool includes a labeling system that identifies exactly which higher timeframe is being displayed on your screen at any given moment. Additionally, it features an optional statistics mode that can calculate and display the price range (in pips) for these bars, helping you gauge volatility.
Key Features for Users
- Contextual Awareness: By showing "Inside" bars from a larger timeframe, the tool helps you see if the current price action is aligned with or contradicting a broader trend.
- Customizable Visuals: You can adjust the width of the drawn objects, choose whether to fill in the candle bodies, and toggle statistics on or off to keep your chart clean.
- Automatic Cleanup: The script is designed to manage its own objects, ensuring that as new data arrives, old visual markers are handled correctly so the chart remains readable.
//+------------------------------------------------------------------+
//|                                       MTF Inside Bar v1.0        |
//|                                  2014 - Joca (nc32007a@gmail.com)|
//+------------------------------------------------------------------+

#property indicator_chart_window

//---- input parameters
extern int       TFup=3;
extern int       bars_back=20;
extern bool      stats=false;
extern color     UpCandleColor=Green;
extern color     DownCandleColor=Salmon;
extern int       width = 3;
extern bool      filling=false;


//---- internal parameters

int timeFrame[] = {1,5,15,30,60,240,1440,10080,43200};
string TimeFrames[] = {"M1","M5","M15","M30","H1","H4","D1","W1","MN"};
int nextTF;
color clr;


//+------------------------------------------------------------------+
//| Custom indicator initialization function                         |
//+------------------------------------------------------------------+

void init()

  {

for(int i=0;i<ArraySize(timeFrame);i++)

{
if(i==ArraySize(timeFrame)-TFup){nextTF=timeFrame[8];Print("Sorry maximum time frame reached");break;}
if(timeFrame[i]==Period()){nextTF=timeFrame[i+TFup];break;}

  }


  }

//+------------------------------------------------------------------+
//| Custor indicator deinitialization function                       |
//+------------------------------------------------------------------+


void deinit()
{

  ObjectsDeleteAll();


}


//+------------------------------------------------------------------+
//| Custom indicator iteration function                              |
//+------------------------------------------------------------------+


int start()


  {


   //----

   datetime dif=Period();
   datetime difTF=nextTF;
   int ii=0;
   int ix=0;
   datetime Tini, Tfim, Tmed;


     {

     while(ix<=bars_back)

     {

      Tini=iTime(NULL,nextTF,ix);
      Tfim=iTime(NULL,nextTF,ix-1)-dif;
      double aux=iClose(NULL,nextTF,ix);
      double range_bar=MathAbs((iClose(NULL,nextTF,ix)-iOpen(NULL,nextTF,ix))*10000);

      if (iOpen(NULL,nextTF,ix) > iClose(NULL,nextTF,ix)) aux=iOpen(NULL,nextTF,ix);

      if (ix<=1) {Tini =iTime(NULL,nextTF,ix); Tfim=Tini+(difTF-dif)*60;}

      Tmed=(Tini+Tfim)/2;

      ObjectDelete("rect"+ii);

      ObjectCreate("rect"+ii,OBJ_RECTANGLE, 0, 0, iOpen(NULL,nextTF,ix), 0, iClose(NULL,nextTF,ix));
      clr=DownCandleColor; if (iOpen(NULL,nextTF,ix) < iClose(NULL,nextTF,ix)) clr=UpCandleColor;

      ObjectSet("rect"+ii, OBJPROP_TIME1,Tini);
      ObjectSet("rect"+ii, OBJPROP_TIME2, Tfim);
      ObjectSet("rect"+ii, OBJPROP_STYLE, STYLE_SOLID);
      ObjectSet("rect"+ii, OBJPROP_BACK, filling);
      ObjectSet("rect"+ii, OBJPROP_COLOR, clr);
      ObjectSet("rect"+ii, OBJPROP_WIDTH, width );
      ObjectSet("rect"+ii, OBJPROP_RAY, False);
      if (stats) ObjectSetText("rect"+ii," This Bar=  "+ MathRound(range_bar)+ " Pips", 15,"Times New Roman",Green);

      ii+=1;

      ObjectDelete("rect"+ii);


      ObjectCreate("rect"+ii,OBJ_TREND, 0, 0, iHigh(NULL,nextTF,ix), 0, aux);
      clr=DownCandleColor; if (iOpen(NULL,nextTF,ix) < iClose(NULL,nextTF,ix)) clr=UpCandleColor;


      ObjectSet("rect"+ii, OBJPROP_TIME1, Tmed);
      ObjectSet("rect"+ii, OBJPROP_TIME2, Tmed);
      ObjectSet("rect"+ii, OBJPROP_STYLE, STYLE_SOLID);
      ObjectSet("rect"+ii, OBJPROP_BACK, 0);
      ObjectSet("rect"+ii, OBJPROP_COLOR, clr);
      ObjectSet("rect"+ii, OBJPROP_WIDTH, width );
      ObjectSet("rect"+ii, OBJPROP_RAY, False);


      ii+=1;

      ObjectDelete("rect"+ii);

      aux=iOpen(NULL,nextTF,ix);

      if (iOpen(NULL,nextTF,ix) > iClose(NULL,nextTF,ix)) aux=iClose(NULL,nextTF,ix);


      ObjectCreate("rect"+ii,OBJ_TREND, 0, 0, iLow(NULL,nextTF,ix), 0, aux);
      clr=DownCandleColor; if (iOpen(NULL,nextTF,ix) < iClose(NULL,nextTF,ix)) clr=UpCandleColor;


      ObjectSet("rect"+ii, OBJPROP_TIME1, Tmed);
      ObjectSet("rect"+ii, OBJPROP_TIME2, Tmed);
      ObjectSet("rect"+ii, OBJPROP_STYLE, STYLE_SOLID);
      ObjectSet("rect"+ii, OBJPROP_BACK, 0);
      ObjectSet("rect"+ii, OBJPROP_COLOR, clr);
      ObjectSet("rect"+ii, OBJPROP_WIDTH, width );
      ObjectSet("rect"+ii, OBJPROP_RAY, False);

      ii+=1;
      ix+=1;

      }

      string Message;


      for(int i=0;i<ArraySize(timeFrame);i++)

      {if(timeFrame[i]==nextTF){Message=TimeFrames[i]+ "\n";}}


      ObjectDelete("Timeframe");

      ObjectCreate   ("Timeframe", OBJ_LABEL, 0, 0, 0);
      ObjectSet      ("Timeframe", OBJPROP_CORNER, 3);
      ObjectSet      ("Timeframe", OBJPROP_YDISTANCE, 40);
      ObjectSet      ("Timeframe", OBJPROP_XDISTANCE, 40);
      ObjectSetText  ("Timeframe", "Inside MTF Bar = "+ Message, 25, "Verdana", Blue);

      WindowRedraw();

}

   return(0);
}
//+------------------------------------------------------------------+--------+
Comments