MMR_HighLowLines
Download script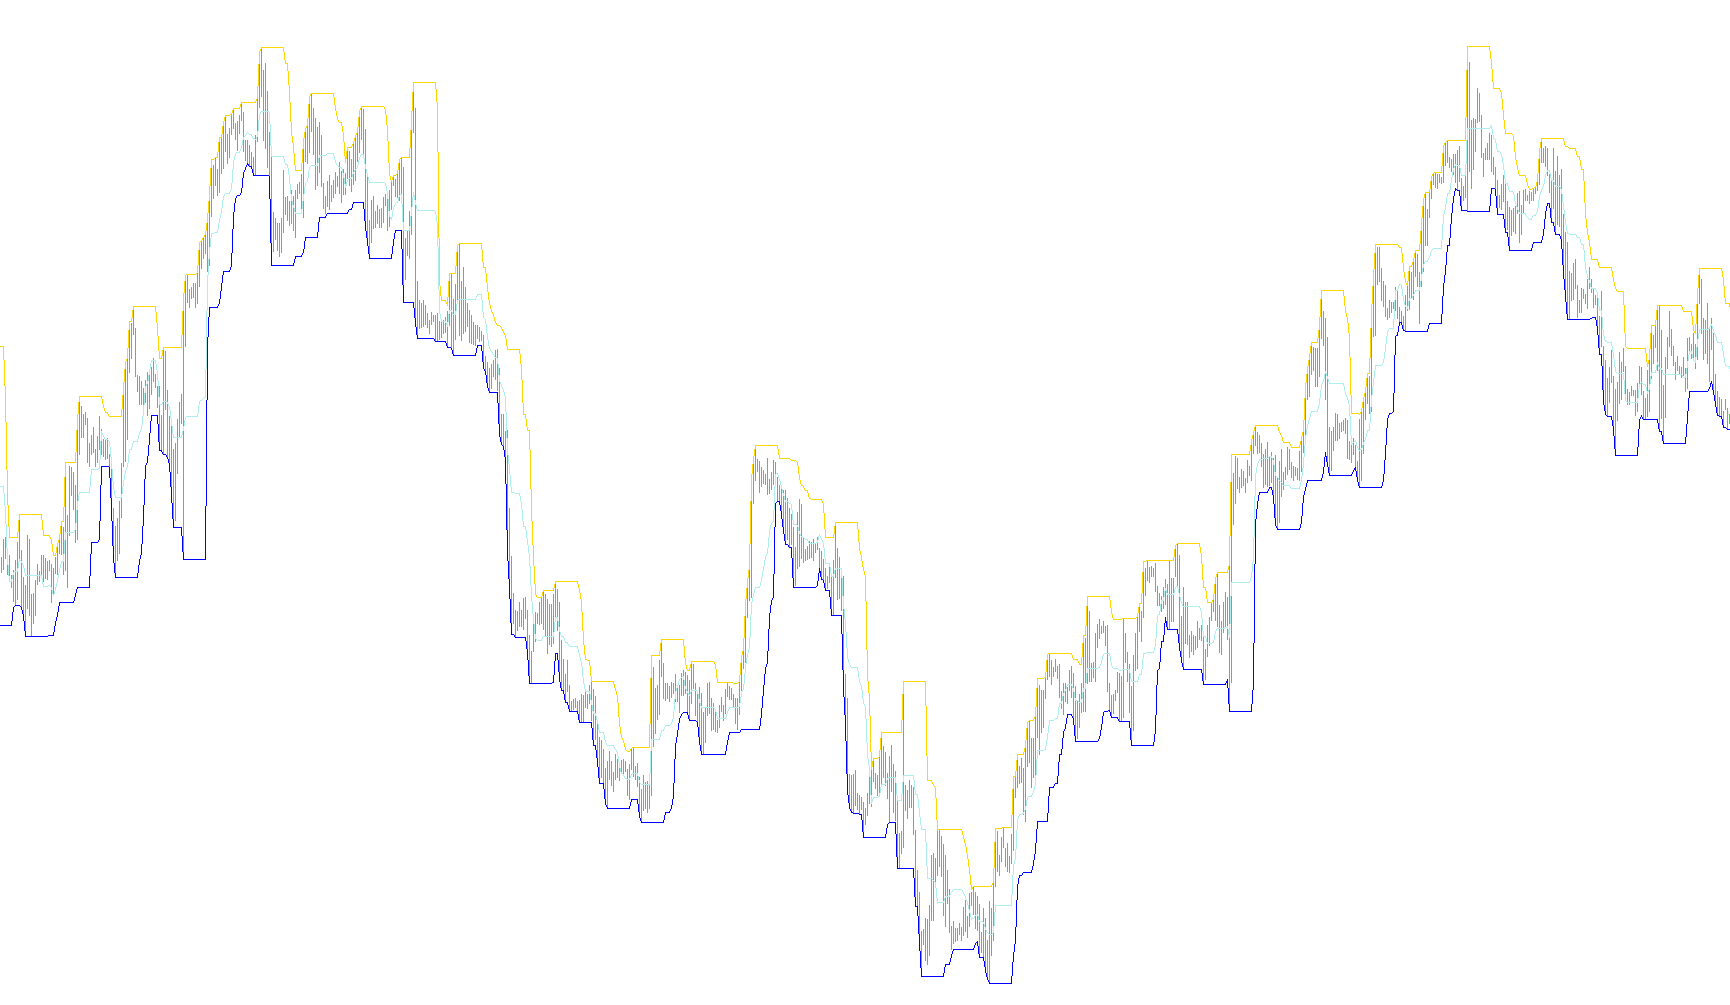
This tool is designed to provide visual clarity on your trading charts by identifying and plotting key price levels based on recent market activity. Instead of looking at just the current price, the script analyzes a specific historical window to help you see where the "boundaries" of the market have been.
How it works:
1. Historical Lookback The logic relies on a user-defined timeframe (the number of bars back) to gather data. By focusing on a set amount of past candles, the script filters out minor "noise" and focuses on the significant price action that occurred during that period.
2. Identifying Key Boundaries For every point on your chart, the script automatically scans the chosen historical window to find two critical values:
- The Highest Point: It locates the absolute peak reached during that timeframe and draws a line representing the "High."
- The Lowest Point: It locates the absolute bottom reached during that timeframe and draws a line representing the "Low."
3. Calculating the Equilibrium In addition to identifying the ceiling and the floor, the script calculates a third value: the Average. It does this by taking the midpoint between the High and the Low. This serves as a visual guide for the "center" of the recent price range.
Visual Representation
The tool renders three distinct lines on your chart:
- High Line: Highlights the upper boundary of recent price movement.
- Low Line: Highlights the lower boundary of recent price movement.
- Average Line: Shows the balanced midpoint between those two extremes.
By providing these three markers simultaneously, the script allows you to see at a glance how the current price relates to the recent range—whether it is pushing against the ceiling, testing the floor, or trading in the middle zone.
//+------------------------------------------------------------------+
//|                                             MMR_HighLowLines.mq4 |
//|                                    Copyright © 2010, EADeveloper |
//|                                                                  |
//+------------------------------------------------------------------+


#property copyright "Copyright © 2010, EADeveloper"
#property link      ""

#property indicator_chart_window
#property indicator_buffers 3
#property indicator_color1 Lime
#property indicator_width1 1
#property indicator_color2 Red
#property indicator_width2 1
#property indicator_color3 Orange
#property indicator_width3 1
extern int BarsBack=12;

//---- buffers
double ExtMapBuffer1[];
double ExtMapBuffer2[];
double ExtMapBuffer3[];
//+------------------------------------------------------------------+
//| Custom indicator initialization function                         |
//+------------------------------------------------------------------+
int init()
  {
//---- indicators
   IndicatorBuffers(3);
   SetIndexStyle(0,DRAW_LINE);
   SetIndexBuffer(0,ExtMapBuffer1);
   SetIndexStyle(1,DRAW_LINE);
   SetIndexBuffer(1,ExtMapBuffer2);
   SetIndexStyle(2,DRAW_LINE);
   SetIndexBuffer(2,ExtMapBuffer3);
   SetIndexLabel(0,"Last High");
   SetIndexLabel(1,"Last Low");
   SetIndexLabel(2,"Average");
   IndicatorShortName("MMR HighLow Lines");

//----
   return(0);
  }
//+------------------------------------------------------------------+
//| Custom indicator deinitialization function                       |
//+------------------------------------------------------------------+
int deinit()
  {
//----

//----
   return(0);
  }
//+------------------------------------------------------------------+
//| Custom indicator iteration function                              |
//+------------------------------------------------------------------+
int start()
  {
   double h,l;
   int counted_bars=IndicatorCounted();
   int limit=Bars-counted_bars;

   for(int i=0; i<limit; i++)
   {
   double hh=High[iHighest(Symbol(),0,MODE_HIGH,BarsBack,i)];
   double ll=Low[iLowest(Symbol(),0,MODE_LOW,BarsBack,i)];
   double av=(hh+ll)/2;
   ExtMapBuffer1[i]=hh;
   ExtMapBuffer2[i]=ll;
   ExtMapBuffer3[i]=av;
   }
   return(0);
  }
//+------------------------------------------------------------------+
Comments