mtf_rsi
Download script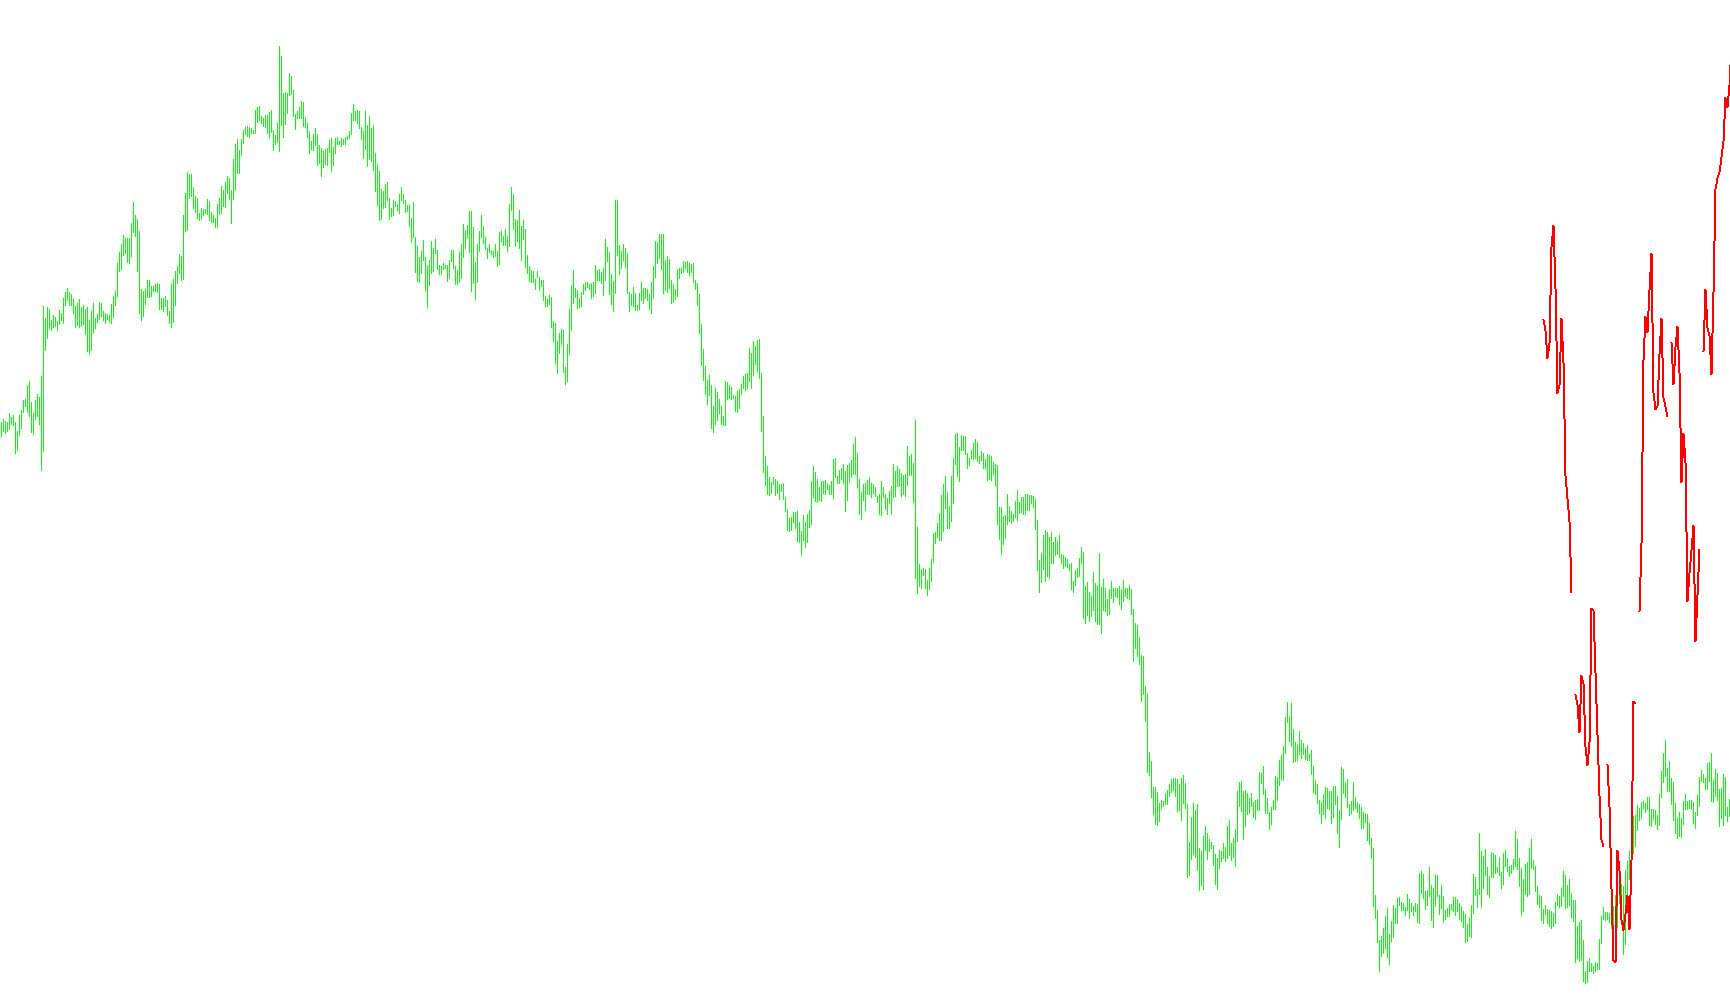
Overview
The MTF RSI script is a specialized trading tool designed to consolidate visual data from multiple different timeframes into a single, easy-to-read chart window. Typically, a trader would have to switch between various charts (such as 1-minute, 1-hour, and Daily) to see the Relative Strength Index (RSI) for each period; this script automates that process by gathering all that information into one unified view.
Core Logic and Functionality
Multi-Timeframe Aggregation The primary logic of the script is its ability to "fetch" data from different chronological scales simultaneously. Instead of only showing you what is happening on your current chart, it scans through a list of timeframes that you define (e.g., Minutes, Hours, Days, Weeks). It then calculates the RSI value for each of those specific periods and plots them side-by-side.
Visual Organization To ensure the data remains readable and doesn't overlap into a confusing mess, the script employs several organizational techniques:
- Sequential Plotting: It arranges the different timeframes in a row, placing a set number of bars for each period so you can see the recent trend of every timeframe at once.
- Dynamic Separation: The script automatically draws vertical separator lines between the different timeframes. This creates a clear visual "boundary," allowing you to distinguish where one timeframe ends and the next begins.
- Automated Labeling: To eliminate guesswork, the script places text labels above each section. These labels identify exactly which timeframe is being displayed in that specific area of the window.
Customization and Orientation The logic includes several "quality of life" features to suit different trading styles:
- Ordering: You can choose whether the most recent timeframe should appear first or if you prefer a specific chronological order.
- Spacing: There is an option to shift the data to the right, which provides extra "breathing room" on your chart to prevent the indicator from overlapping with the price candles.
- Visual Styling: Users can customize the colors of the lines, the text labels, and the separators to match their specific workspace aesthetic.
Summary for the User
In short, this script acts as a dashboard. It eliminates the need to jump back and forth between different charts by synthesizing the momentum data (RSI) of multiple timeframes into one organized, labeled, and separated visual display at the bottom of your screen.
//+------------------------------------------------------------------+
//|                                                      MTF RSI.mq4 |
//|                     Provided by Filter for the MQL5.com codebase |
//+------------------------------------------------------------------+
//
//
//+------------------------------------------------------------------+
//|                      NOTE FROM FILTER                            |
//| I can't remember where I found the original open source code but |
//| it no longer worked for the latest MT4. I fixed it for build     |
//| 600+, cleaned up the code and added several new options. Kudos   |
//| to the unknown original coder!                                   |
//+------------------------------------------------------------------+

#property copyright   "Public domain software, provided by Filter for the MQL5.com codebase"
#property link        "https://login.mql5.com/en/users/filter"
#property version     "2.0"
#property strict
#property description "A multi timeframe (MTF) Relative Strength Indicator (RSI). It gives you the ability to see the"
#property description "RSI from multiple time frames in one window at the bottom of your chart. The code can be easily"
#property description "adapted for any oscillator: MACD, ATR, CCI etc"


#property script_show_inputs
#property indicator_separate_window
#property indicator_minimum 0
#property indicator_maximum 100
#property indicator_buffers 1
#property indicator_color1 Black
#property indicator_level1 30
#property indicator_level2 50
#property indicator_level3 70
#property indicator_levelcolor DimGray

#define indicatorName "MTF RSI"

// Inputs
//---

input int                 RSIperiod             = 14;                   // RSI Period
input ENUM_APPLIED_PRICE  AppliedTo            = PRICE_MEDIAN;          // Apply to price
extern string             timeFrames           = "M1;H1;H4;D1;W1;MN";   // Chose timeframes to display, separate with ;
extern int                barsPerTimeFrame     = 15;                    // Bars displayed per timeframe
input bool                shiftToRight         = False;                 // Shift to hard right?
input bool                currentPeriodFirst   = False;                 // Display current period first?
input color               textColor            = Blue;                  // Text color
input color               separatorColor       = DimGray;               // Seperator color
input color               LineColor            = Red;                   // Line colour
input int                 LineWidth            = 2;                     // Line width
//---


// Buffer
//---

double ExtMapBuffer1[];


// Indicator globals (not MT4 globals)
//---

string shortName;
string labels[];
int    periods[];
int    Shift;


//+------------------------------------------------------------------+
//|Initialization                                                    |
//+------------------------------------------------------------------+

int OnInit()
{
   if(shiftToRight) Shift=1;
   else             Shift=0;

   barsPerTimeFrame=MathMax(barsPerTimeFrame,1);
   shortName=indicatorName+" ("+IntegerToString(RSIperiod)+")";
   IndicatorShortName(shortName);

   SetIndexStyle(0,DRAW_LINE,0,LineWidth,LineColor);
   SetIndexBuffer(0,ExtMapBuffer1);
   SetIndexShift(0,Shift*(barsPerTimeFrame+1));
   SetIndexLabel(0,"RSI");

   timeFrames=StringUpperCase(StringTrimLeft(StringTrimRight(timeFrames)));
   if(StringSubstr(timeFrames,StringLen(timeFrames),1)!=";") timeFrames=StringConcatenate(timeFrames,";");

   int position= 0;
   int sepFind = StringFind(timeFrames,";",position);
   int time;
   string current;
   while(sepFind>0)
   {
      current = StringSubstr(timeFrames,position,sepFind-position);
      time    = stringToTimeFrame(current);
      if(time>0)
      {
         ArrayResize(labels,ArraySize(labels)+1);
         ArrayResize(periods,ArraySize(periods)+1);
         labels[ArraySize(labels)-1]=current;
         periods[ArraySize(periods)-1]=time;
      }
      position= sepFind+1;
      sepFind = StringFind(timeFrames,";",position);
   }

   if(currentPeriodFirst)
   {
      for(int i=1;i<ArraySize(periods);i++)
      {
         if(Period()==periods[i])
         {
            string tmpLabel=labels[i];
            int    tmpPeriod=periods[i];

            for(int k=i;k>0; k--)
            {
               labels[k]  = labels[k-1];
               periods[k] = periods[k-1];
            }
            labels[0]  = tmpLabel;
            periods[0] = tmpPeriod;
         }
     }
   }
   return(INIT_SUCCEEDED);
}

//+------------------------------------------------------------------+
//| Deinitialization                                                 |
//+------------------------------------------------------------------+

void OnDeinit(const int reason)
{
   // Cleanup
   for(int l=0;l<ArraySize(periods);l++)
   {
      ObjectDelete(indicatorName+IntegerToString(l));
      ObjectDelete(indicatorName+IntegerToString(l)+"label");
   }
   Print(__FUNCTION__,"_UninitReason = ",getUninitReasonText(_UninitReason));
   return;
}

//+------------------------------------------------------------------+
//| Iterator function                                                            |
//+------------------------------------------------------------------+

int start()
{
   string separatorLine,periodLabel;
   int    window=WindowFind(shortName);
   int    k=0;

   // Output all RSI timeframes to buffer
   for(int p=0; p<ArraySize(periods);p++)
   {
      for(int i=0; i<barsPerTimeFrame;i++,k++)
      {
         ExtMapBuffer1[k]=iRSI(NULL,periods[p],RSIperiod,AppliedTo,i);
      }

      // Blank bar between timeframes
      ExtMapBuffer1[k]=EMPTY_VALUE;
      k+=1;

      // Draw seperator line between timeframes
      separatorLine=indicatorName+IntegerToString(p);
      if(ObjectFind(separatorLine)==-1) ObjectCreate(separatorLine,OBJ_TREND,window,0,0);

      ObjectSet(separatorLine,OBJPROP_TIME1,barTime(k-Shift*(barsPerTimeFrame+1)-1));
      ObjectSet(separatorLine,OBJPROP_TIME2,barTime(k-Shift*(barsPerTimeFrame+1)-1));
      ObjectSet(separatorLine,OBJPROP_PRICE1,0);
      ObjectSet(separatorLine,OBJPROP_PRICE2,100);
      ObjectSet(separatorLine,OBJPROP_COLOR,separatorColor);
      ObjectSet(separatorLine,OBJPROP_WIDTH,2);

      // Draw time frame labels
      periodLabel=indicatorName+IntegerToString(p)+"label";
      if(ObjectFind(periodLabel)==-1) ObjectCreate(periodLabel,OBJ_TEXT,window,0,0);

      ObjectSet(periodLabel,OBJPROP_TIME1,barTime(k-Shift*(barsPerTimeFrame+1)-((barsPerTimeFrame/2)+1))); // Center labels
      ObjectSet(periodLabel,OBJPROP_PRICE1,100);
      ObjectSetText(periodLabel,labels[p],9,"Arial",textColor);

   }

   SetIndexDrawBegin(0,Bars-k);
   return(0);
}

//+------------------------------------------------------------------+
//+ Functions                                                        |
//+------------------------------------------------------------------+

int barTime(int myBar)
{
   if(myBar<0)
   {
      return((int)Time[0]+Period()*60*MathAbs(myBar));
   }
   else
   {
      return((int)Time[myBar]);
   }
}

//+------------------------------------------------------------------+

int stringToTimeFrame(string TimeFrame)
{
   int TimeFrameInt=0;

   if(TimeFrame=="M1")    TimeFrameInt=PERIOD_M1;
   if(TimeFrame=="M5")    TimeFrameInt=PERIOD_M5;
   if(TimeFrame=="M15")   TimeFrameInt=PERIOD_M15;
   if(TimeFrame=="M30")   TimeFrameInt=PERIOD_M30;
   if(TimeFrame=="H1")    TimeFrameInt=PERIOD_H1;
   if(TimeFrame=="H4")    TimeFrameInt=PERIOD_H4;
   if(TimeFrame=="D1")    TimeFrameInt=PERIOD_D1;
   if(TimeFrame=="W1")    TimeFrameInt=PERIOD_W1;
   if(TimeFrame=="MN")    TimeFrameInt=PERIOD_MN1;

   return(TimeFrameInt);
}

//+------------------------------------------------------------------+

string StringUpperCase(string str)
{
   string   myStr=str;
   int      iLength=StringLen(myStr)-1;
   int      iChar;

   while(iLength>=0)
   {
      iChar=StringGetChar(myStr,iLength);

      if((iChar>96 && iChar<123) || (iChar>223 && iChar<256))
      {
         myStr=StringSetChar(myStr,iLength,(ushort)(iChar-32));
      }
      else
      {
         if(iChar>-33 && iChar<0)
         {
            myStr=StringSetChar(myStr,iLength,(ushort)(iChar+224));
         }
      }
      iLength--;
   }

   return(myStr);
}

//+------------------------------------------------------------------+

string getUninitReasonText(int reasonCode)
{
   string text="";

   switch(reasonCode)
   {
      case REASON_ACCOUNT:
         text="Account was changed";break;
      case REASON_CHARTCHANGE:
         text="Symbol or timeframe was changed";break;
      case REASON_CHARTCLOSE:
         text="Chart was closed";break;
      case REASON_PARAMETERS:
         text="Input-parameter was changed";break;
      case REASON_RECOMPILE:
         text="Program "+__FILE__+" was recompiled";break;
      case REASON_REMOVE:
         text="Program "+__FILE__+" was removed from chart";break;
      case REASON_TEMPLATE:
         text="New template was applied to chart";break;
      default:text="Another reason";
   }

   return text;
}
//+------------------------------------------------------------------+
Comments