MALRFast
Download script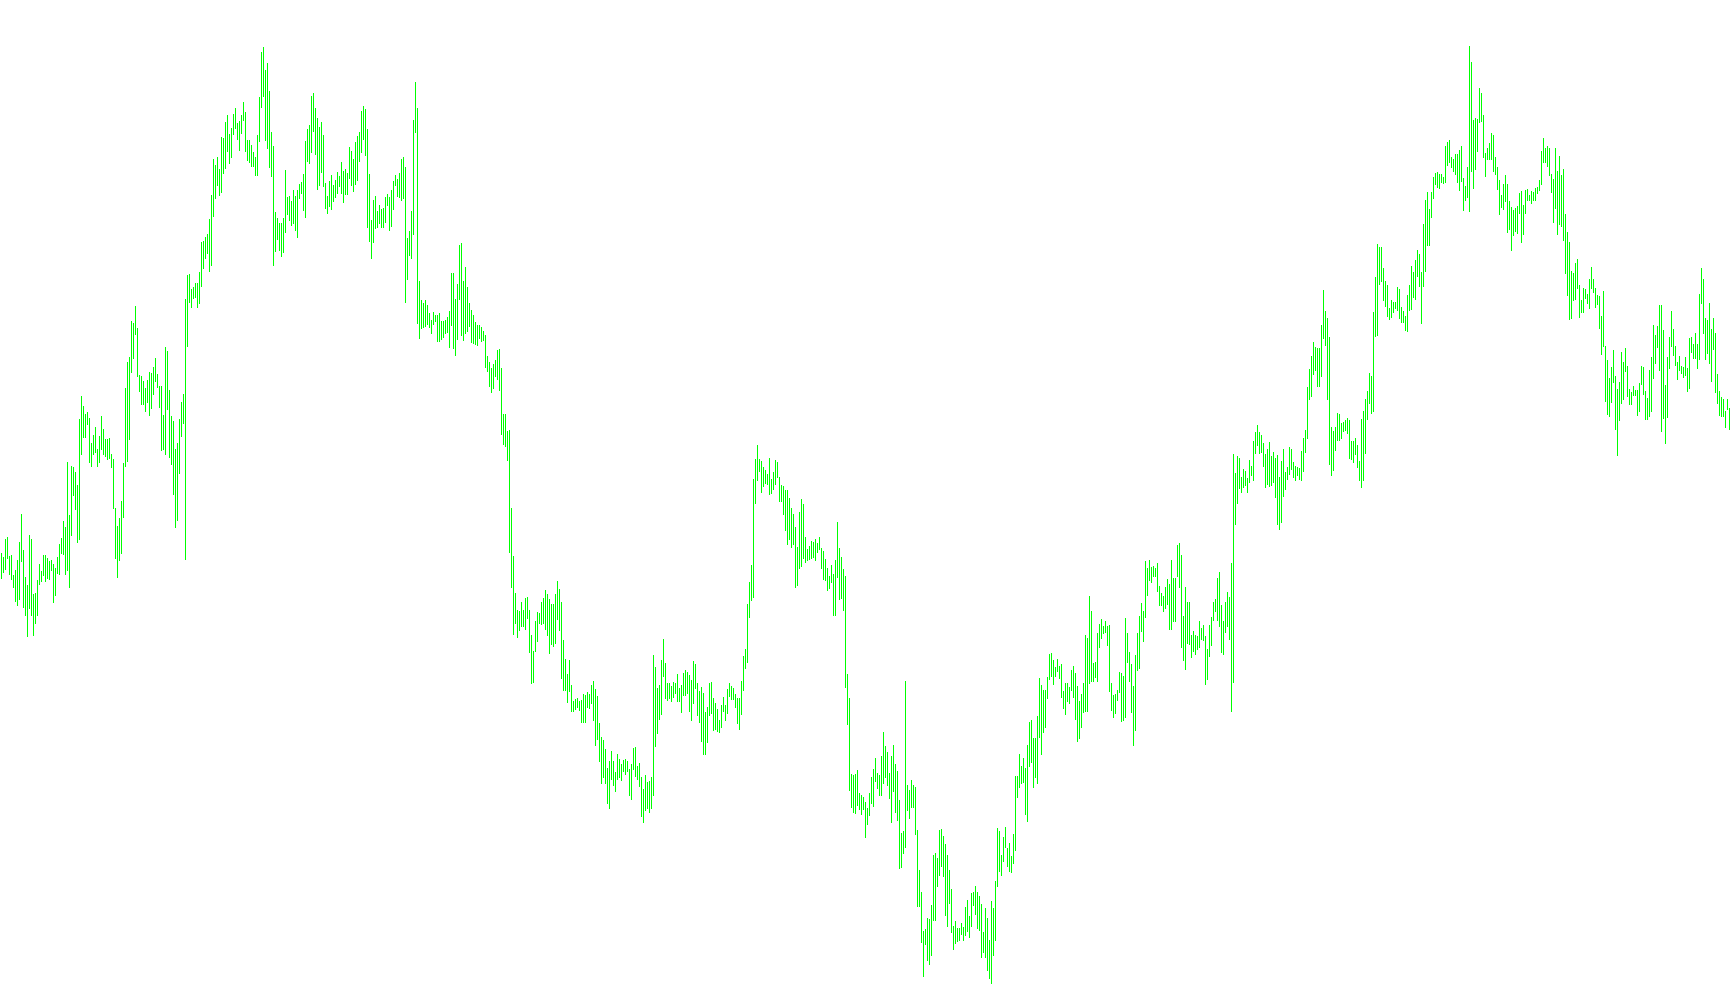
This tool is designed as a visual technical indicator for trading platforms, specifically engineered to identify trends by combining two different types of moving averages into a single specialized calculation.
Core Logic and Mechanism
The script functions by analyzing historical price data—specifically the closing prices of assets—to calculate two distinct types of "averages" simultaneously:
- Simple Moving Average (SMA): This provides a standard, steady look at the average price over a set period.
- Linear Weighted Moving Average (LWMA): This places more importance on recent price action, making it more sensitive to current market momentum.
Instead of simply showing you these two lines individually, the script performs a sophisticated mathematical blend. It calculates the difference between these two averages and applies specific multipliers to them. By doing this, the tool creates a unique "hybrid" line that reacts to market changes with a balance of smoothness (from the SMA) and responsiveness (from the LWMA).
How it Operates
- Data Processing: The script looks back at a user-defined number of bars (the "Maperiod") to determine the current trend. It requires a specific amount of historical data to be present on the chart before it begins to display results, ensuring the accuracy of its calculations.
- Dynamic Calculation: As new price information enters the market, the script updates the averages continuously. It uses a recursive calculation method, meaning it uses the previous period's results to help calculate the current one, which allows for efficient and fluid movement on the chart.
- Visual Output: The final result is displayed as a single "Gold" colored line. This line represents the mathematical relationship between the two averages, acting as a filtered signal of price momentum.
Summary for the Trader
Essentially, this indicator serves as a "filtered trend follower." It removes some of the "noise" found in raw price movements while remaining more reactive than a standard moving average. By combining the stability of an SMA with the urgency of an LWMA into one visual element, it provides a clearer picture of whether the market's underlying momentum is accelerating or decelerating.
#property  copyright "BECEMAL"
#property  link      "http://www.becemal.ru/"
#property  indicator_chart_window
//#property  indicator_separate_window
#property indicator_buffers 1
#property indicator_color1 Gold

extern   int   MAPeriod = 24;
extern   int   NeedCountBars = 2048;
int   NeedBars;
double   N, DN, NLW, DNLW, SMAPrev = 0.0, LWMAPrev = 0.0;
double Buff[];
//datetime TimePrev = 0;

int init()  {
if(MAPeriod < 3)  MAPeriod = 24;
N = MAPeriod;
NLW = 0.5 * N * (N + 1.0);
DN = 1 / N;
DNLW = 1 / NLW;
if(NeedCountBars < 1) NeedBars = Bars - MAPeriod - 1;
else  NeedBars = NeedCountBars;
SetIndexStyle(0,DRAW_LINE);
SetIndexBuffer(0,Buff);
SetIndexDrawBegin(0, NeedBars);
SetIndexLabel(0, "LRMA(" + MAPeriod + ")");
return(0);  }

int start() {
if(Bars < NeedBars + MAPeriod)   {
   Print("No Data");
   return(0);  }
int    i, limit, Error, counted_bars = IndicatorCounted();
double newSMA, newLWMA, newPrice;
limit = Bars - counted_bars - 1;
if(limit > NeedBars) limit = NeedBars;
if(counted_bars < 2) {
   newLWMA = iMA(NULL,0,MAPeriod,0,MODE_LWMA,PRICE_CLOSE,limit);
   newSMA = iMA(NULL,0,MAPeriod,0,MODE_SMA,PRICE_CLOSE,limit);
   Buff[limit] = 3.0 * newLWMA - 2.0 * newSMA;
   limit--;
   SMAPrev = newSMA * N;
   LWMAPrev = newLWMA * NLW;  }
//if(Time != TimePrev) {
//   TimePrev = Time;
//   SMAPrev = newSMA;
//   LWMAPrev = newLWMA;  }
for(i = limit; i >= 0; i--)   {
   newPrice = Close[i];
   newLWMA = LWMAPrev + (N * newPrice - SMAPrev);
   newSMA = SMAPrev + (newPrice - Close[i + MAPeriod]);
   Buff[i] = 3.0 * DNLW * newLWMA - 2.0 * DN * newSMA;
   if(i > 0)  {
      SMAPrev = newSMA;
      LWMAPrev = newLWMA;  }  }
return(0);
}
Comments