Kolier_SuperTrend_Indi
Download script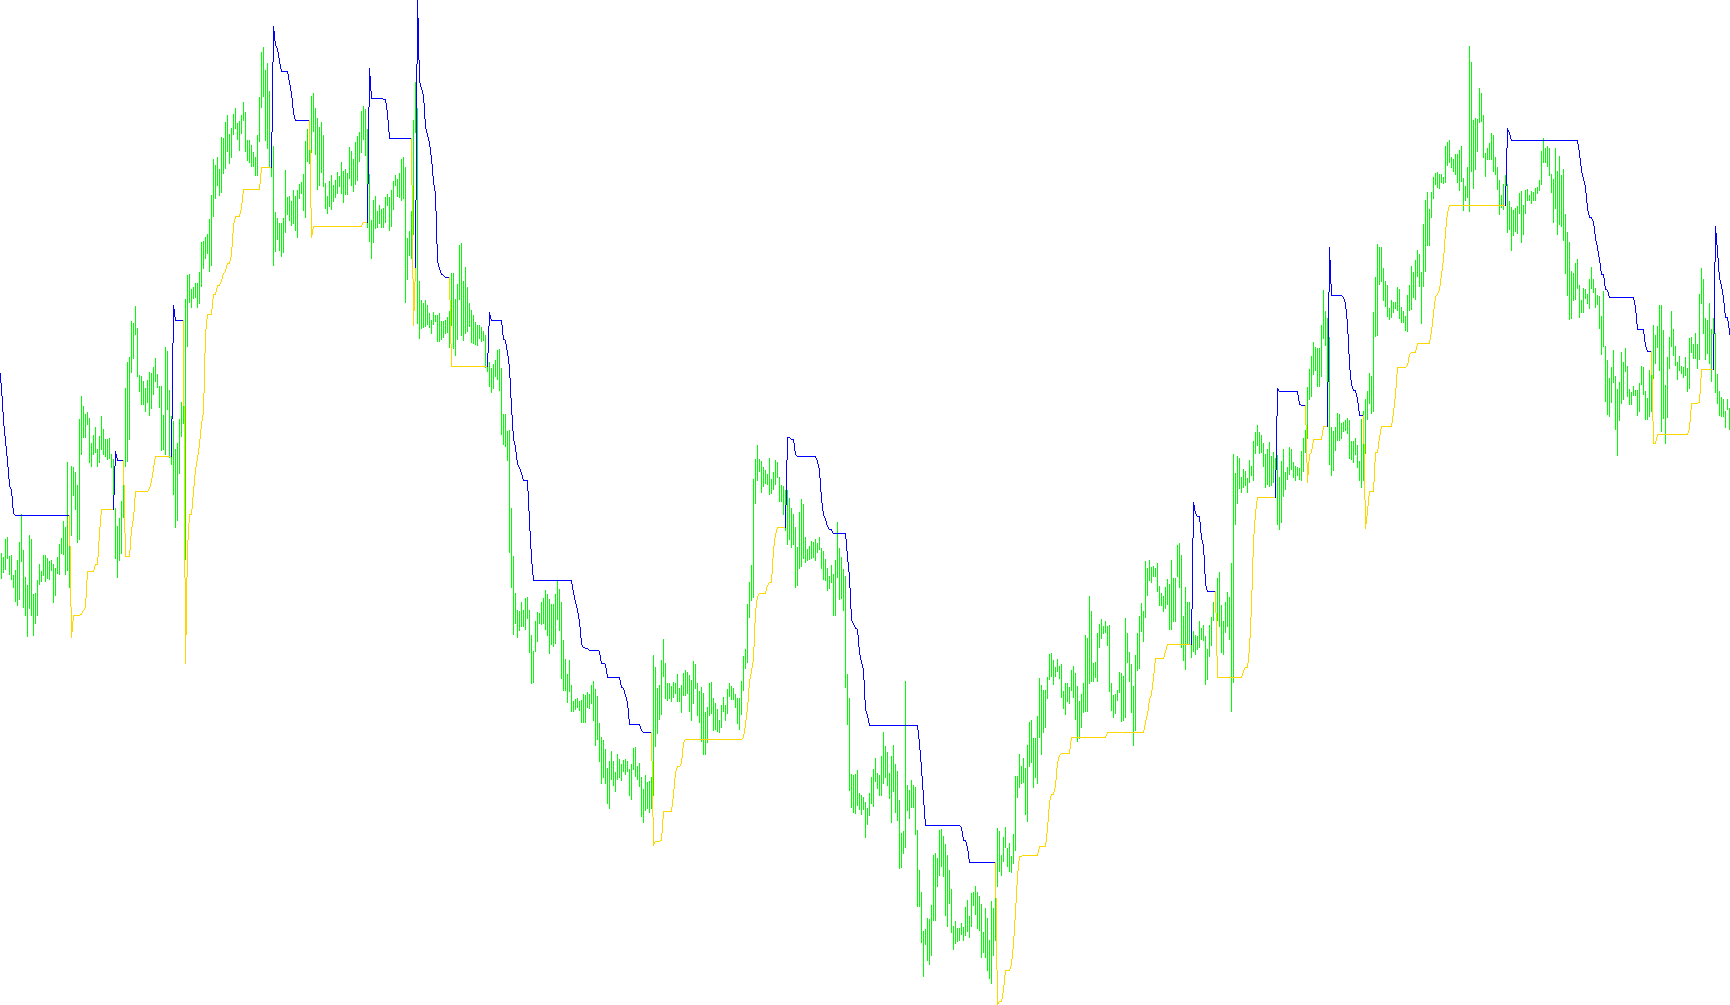
This tool is designed as a visual trend-following indicator for the MetaTrader 4 platform. Its primary purpose is to help traders identify whether the current market direction is bullish (upward) or bearish (downward) by plotting a dynamic line on the price chart.
How It Works
The logic behind the indicator relies on two main components: volatility measurement and price action tracking.
1. Volatility Calculation The script uses a common technical analysis tool called the Average True Range (ATR). This measures how much the price moves, on average, during a specific period. By combining this volatility data with the high and low prices of the candles, the script establishes an "upper band" and a "lower band." Think of these as the boundaries that define the current momentum of the market.
2. Trend Detection The indicator constantly monitors the closing price of the candles relative to its own calculated bands:
- Switching to Bullish: If the price closes above a downward-trending boundary, the script recognizes a shift in momentum and switches to a "Buy" phase. It then begins plotting an upward-moving line.
- Switching to Bearish: If the price closes below an upward-trending boundary, the script recognizes a move toward a downward trend and switches to a "Sell" phase, plotting a downward-moving line.
3. Trend Smoothing To prevent the lines from jumping erratically, the logic includes a smoothing mechanism. Instead of simply jumping to a new price point every time the market moves, the indicator compares the current volatility band with the previous value. It ensures that the trend line remains continuous and stable, only moving forward when the market confirms a sustained shift in direction.
Visual Representation
On your chart, this will manifest as a clear line that changes color (typically Lime for upward trends and Red for downward trends).
- When the line is climbing, it signals a prevailing Up Trend.
- When the line is falling, it signals a prevailing Down Trend.
Key Customizations
Users can adjust the following to fit their specific trading style:
- ATR Period & Multiplier: These allow you to make the indicator more sensitive (reacting quickly to small price changes) or more conservative (reacting only to large, significant moves).
- Trend Mode: This provides different visual styles for how the trend line is drawn on the screen, allowing for personal preference in chart readability.
//+------------------------------------------------------------------+
//|                                       Kolier_SuperTrend_Indi.mq4 |
//|                                       Copyright 2010, KoliEr Li. |
//|                                                 http://kolier.li |
//+------------------------------------------------------------------+
/*
 * I here get paid to program for you. Just $15 for all scripts.
 *
 * I am a bachelor major in Financial-Mathematics.
 * I am good at programming in MQL for Meta Trader 4 platform. Senior Level. Have done hundreds of scripts.
 * No matter what it is, create or modify any indicators, expert advisors and scripts.
 * I will ask these jobs which are not too large, price from $15, surely refundable if you are not appreciate mine.
 * All products will deliver in 3 days.
 * Also, I am providing EA, Indicator and Trade System Improvement Consultant services, contact me for the detail.
 * If you need to have it done, don't hesitate to contact me at: kolier.li@gmail.com
 */

//+------------------------------------------------------------------+
//| Indicator Properties                                             |
//+------------------------------------------------------------------+
#property copyright "Copyright 2010, KoliEr Li."
#property link      "http://kolier.li"
// Client:
// Tags: SuperTrend, ATR
// Revision: 1

/* Change Logs */
/*
*/

#property indicator_chart_window
#property indicator_buffers 2
#property indicator_color1 Lime
#property indicator_color2 Red
#property indicator_width1 2
#property indicator_width2 2

//+------------------------------------------------------------------+
//| Universal Constants                                              |
//+------------------------------------------------------------------+
#define PHASE_NONE 0
#define PHASE_BUY 1
#define PHASE_SELL -1

//+------------------------------------------------------------------+
//| User input variables                                             |
//+------------------------------------------------------------------+
extern string    AdvisorName = "Kolier_SuperTrend_Indi";
extern string AdvisorVersion = "1.0.1";            // The version number of this script
extern string    ProjectPage = "http://kolier.li/project/kolier-supertrend-indi";            // The project landing page
extern int       BarsToCount = 0;    // Set to 0 to count all bars, if >0, set more to calculate more bars
extern int         TrendMode = 0;    // 0=Show line same as SuperTrend.mq4, 1=New way to show trend line
// iATR
extern string ATR_Indicator = "http://kolier.li/example/mt4-iatr-system-average-true-range";
extern int       ATR_Period = 10;
extern double ATR_Multiplier = 3.0;

//+------------------------------------------------------------------+
//| Universal variables                                              |
//+------------------------------------------------------------------+
double buffer_line_up[], buffer_line_down[];
double atr, band_upper, band_lower;
int phase=PHASE_NONE;

//+------------------------------------------------------------------+
//| Custom indicator initialization function                         |
//+------------------------------------------------------------------+
int init()
  {
   IndicatorShortName(AdvisorName);
   IndicatorDigits(MarketInfo(Symbol(), MODE_DIGITS));

   SetIndexBuffer(0, buffer_line_up);
   SetIndexLabel(0, "Up Trend");
   SetIndexBuffer(1, buffer_line_down);
   SetIndexLabel(1, "Down Trend");

   return(0);
  }

//+------------------------------------------------------------------+
//| Custom indicator deinitialization function                       |
//+------------------------------------------------------------------+
int deinit()
  {
   return(0);
  }

//+------------------------------------------------------------------+
//| Custom indicator iteration function                              |
//+------------------------------------------------------------------+
int start()
  {
   int bars_counted = IndicatorCounted();
   if(bars_counted < 0) {
      return(1);
   }
   else if(bars_counted > 0) {
      bars_counted--;
   }
   int limit = Bars - bars_counted;
   if(BarsToCount>0 && limit>BarsToCount) {
      limit = BarsToCount;
   }

   for(int i=limit; i>=0; i--) {
      atr = iATR(Symbol(), 0, ATR_Period, i);
      band_upper = (High[i]+Low[i])/2 + ATR_Multiplier * atr;
      band_lower = (High[i]+Low[i])/2 - ATR_Multiplier * atr;

      if(phase==PHASE_NONE) {
         buffer_line_up[i] = (High[i+1]+Low[i+1])/2;
         buffer_line_down[i] = (High[i+1]+Low[i+1])/2;
      }

      if(phase!=PHASE_BUY && Close[i]>buffer_line_down[i+1] && buffer_line_down[i+1]!=EMPTY_VALUE) {
         phase = PHASE_BUY;
         buffer_line_up[i] = band_lower;
         buffer_line_up[i+1] = buffer_line_down[i+1];
      }

      if(phase!=PHASE_SELL && Close[i]<buffer_line_up[i+1] && buffer_line_up[i+1]!=EMPTY_VALUE) {
         phase = PHASE_SELL;
         buffer_line_down[i] = band_upper;
         buffer_line_down[i+1] = buffer_line_up[i+1];
      }

      if(phase==PHASE_BUY
         && ((TrendMode==0 && buffer_line_up[i+2]!=EMPTY_VALUE) || TrendMode==1) ) {
         if(band_lower>buffer_line_up[i+1]) {
            buffer_line_up[i] = band_lower;
         }
         else {
            buffer_line_up[i] = buffer_line_up[i+1];
         }
      }
      if(phase==PHASE_SELL
         && ((TrendMode==0 && buffer_line_down[i+2]!=EMPTY_VALUE) || TrendMode==1) ) {
         if(band_upper<buffer_line_down[i+1]) {
            buffer_line_down[i] = band_upper;
         }
         else {
            buffer_line_down[i] = buffer_line_down[i+1];
         }
      }

   }

   return(0);
  }
Comments